Experiment
AFM Observation
In order to evaluate our concept of size-controllable linear homo-multimer, we first tried to confirm its shape by AFM. We prepared a sample of monomer which does not connect each other by adding single-strand loop of DNA to prevent blunt end stacking between the monomers. Also, we have samples which have and do not have a twist on the shaft. Hereafter we call them like monomer (+/-), where the first and the second signs correspond to with/without stacking and with/without twist, respectively (Table 1).
| Stack | Twist | |
|---|---|---|
| Monomer (+/+) | + | + |
| Monomer (+/-) | + | - |
| Monomer (-/+) | - | + |
| Monomer (-/-) | - | - |
Firstly, the result of AFM imaging of monomer (-/-) is shown in Fig. 1. The topographical data shows that the monomer (-/-) was 8 nm high, suggesting that it had at least 4 layers of DNA double helices because the diameter of DNA double helix is 2 nm. The height also indicates that the monomer had a shaft inside a cylinder. Although they were expected not to stack, they formed multimers. It might be caused because single-stranded loops at the ends were not long enough.
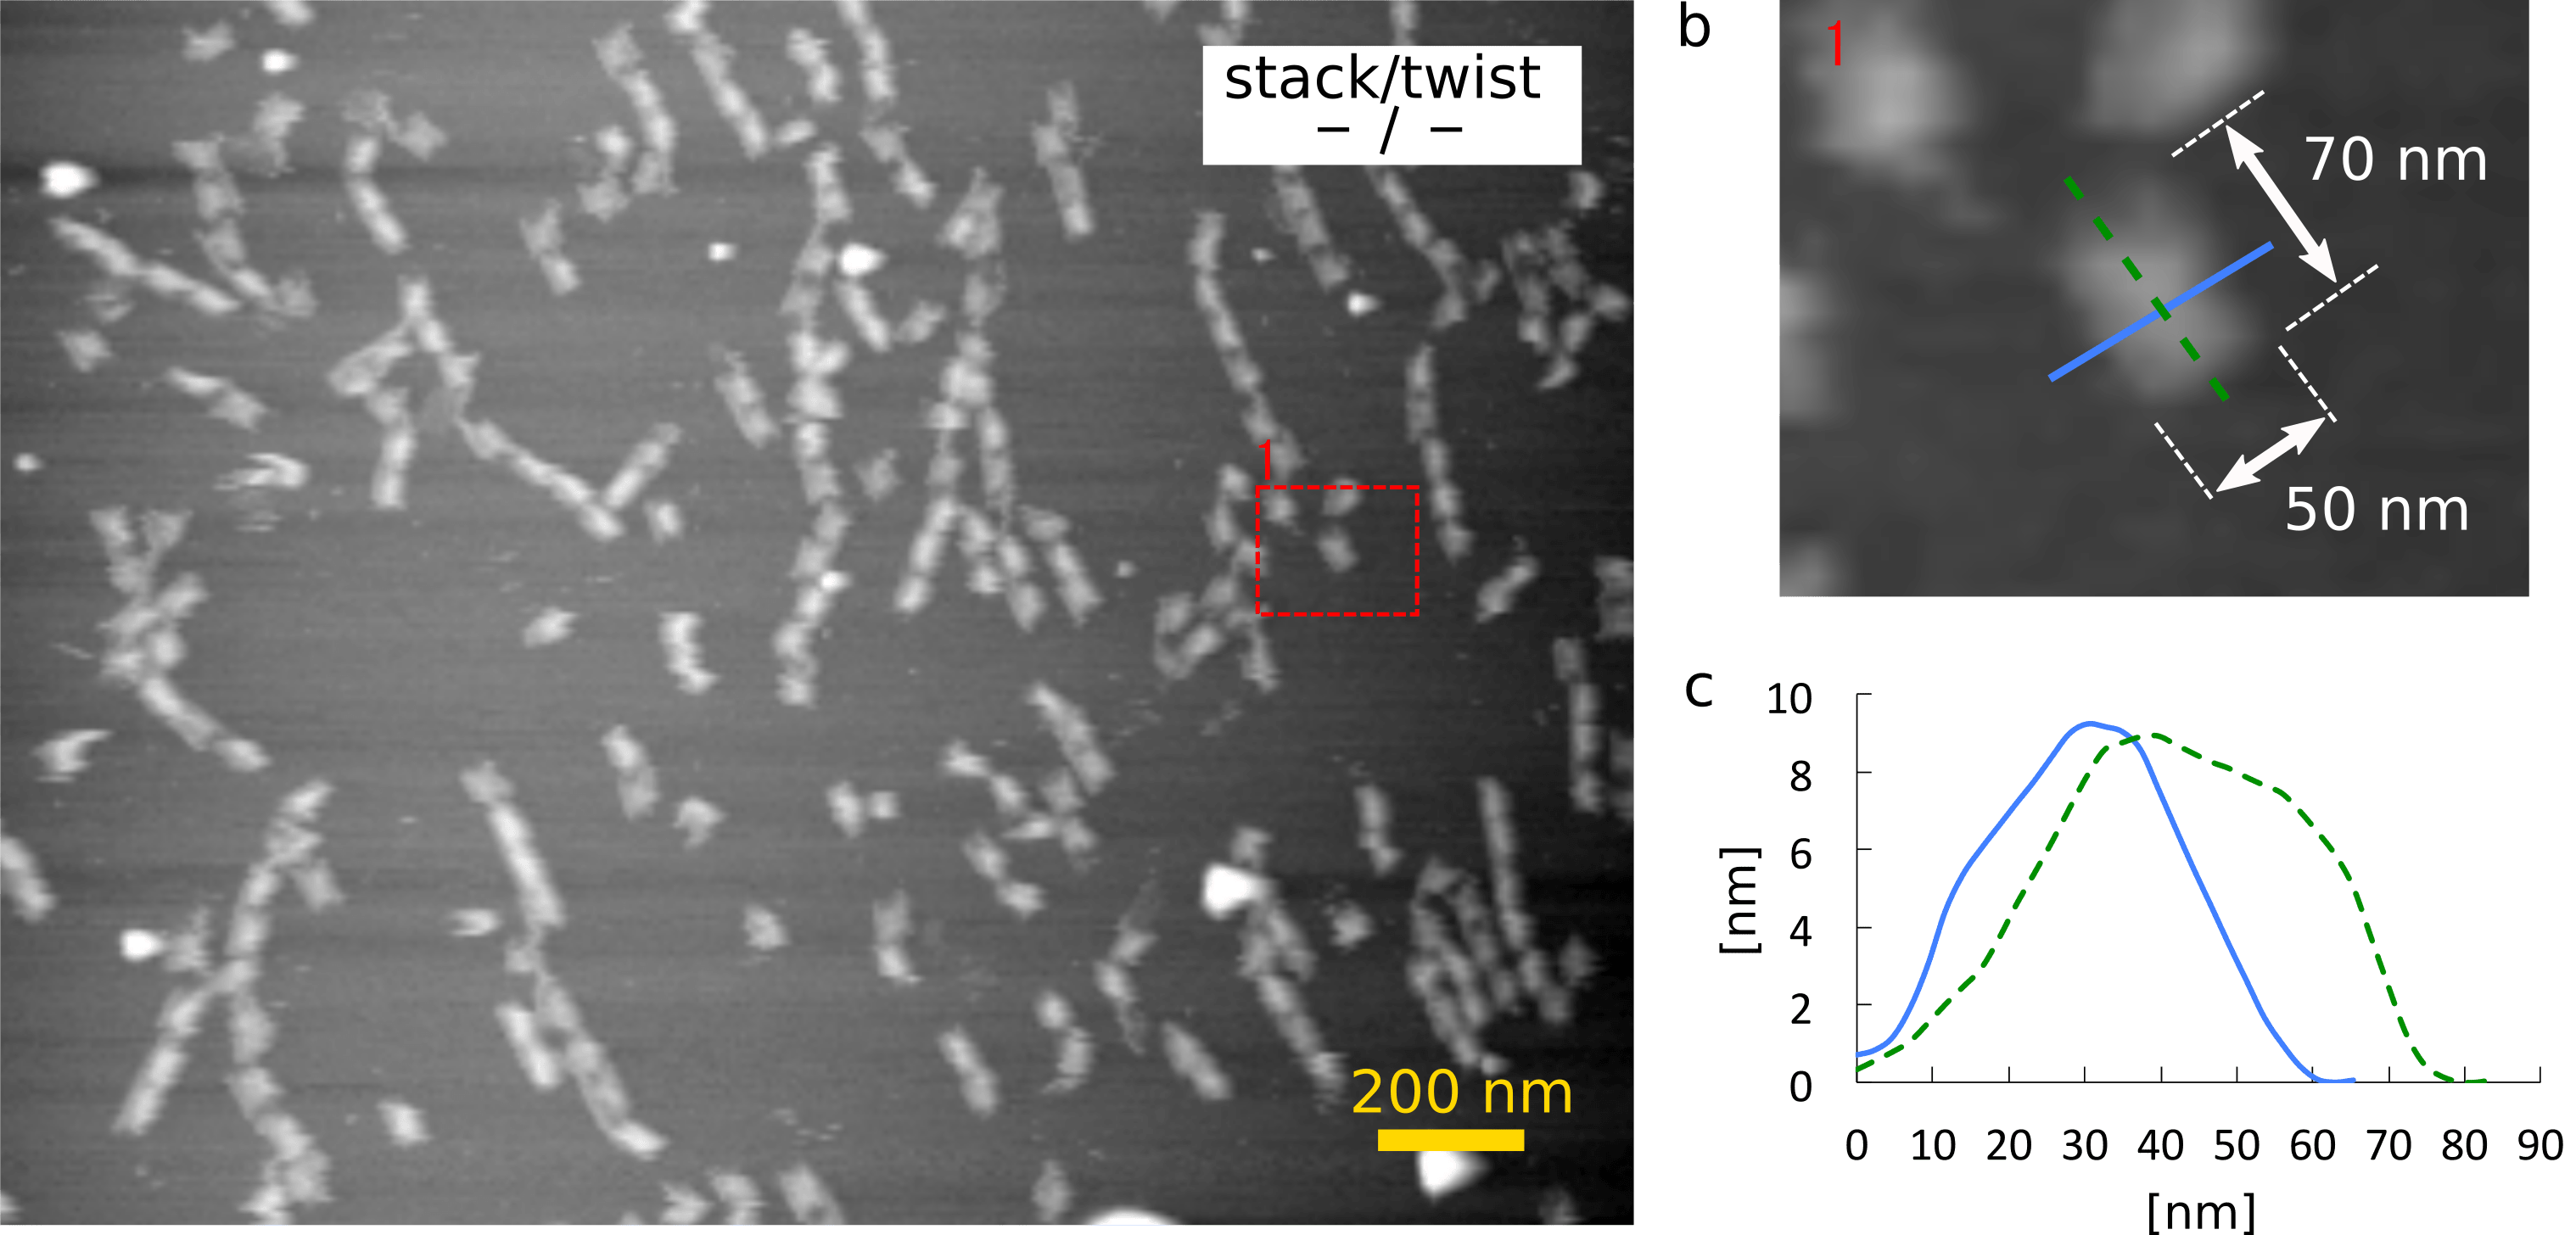
(a) Zoom-out image
(b) Zoom-in image and the size of the monomer
(c) The height of the monomer in the cross section of (b)
Secondly, we replaced some of the staples at the end of the surfaces so that the monomer can bind together by blunt end stacking. This monomer is called monomer (+/-). Since this monomer does not have twist in the shaft, it is expected to stack as many as they can. The AFM image of this sample actually implies this (Fig. 2-a). As a typical example, a multimer with 10 monomers and its section profile are shown in Fig. 2-b and 2-c.
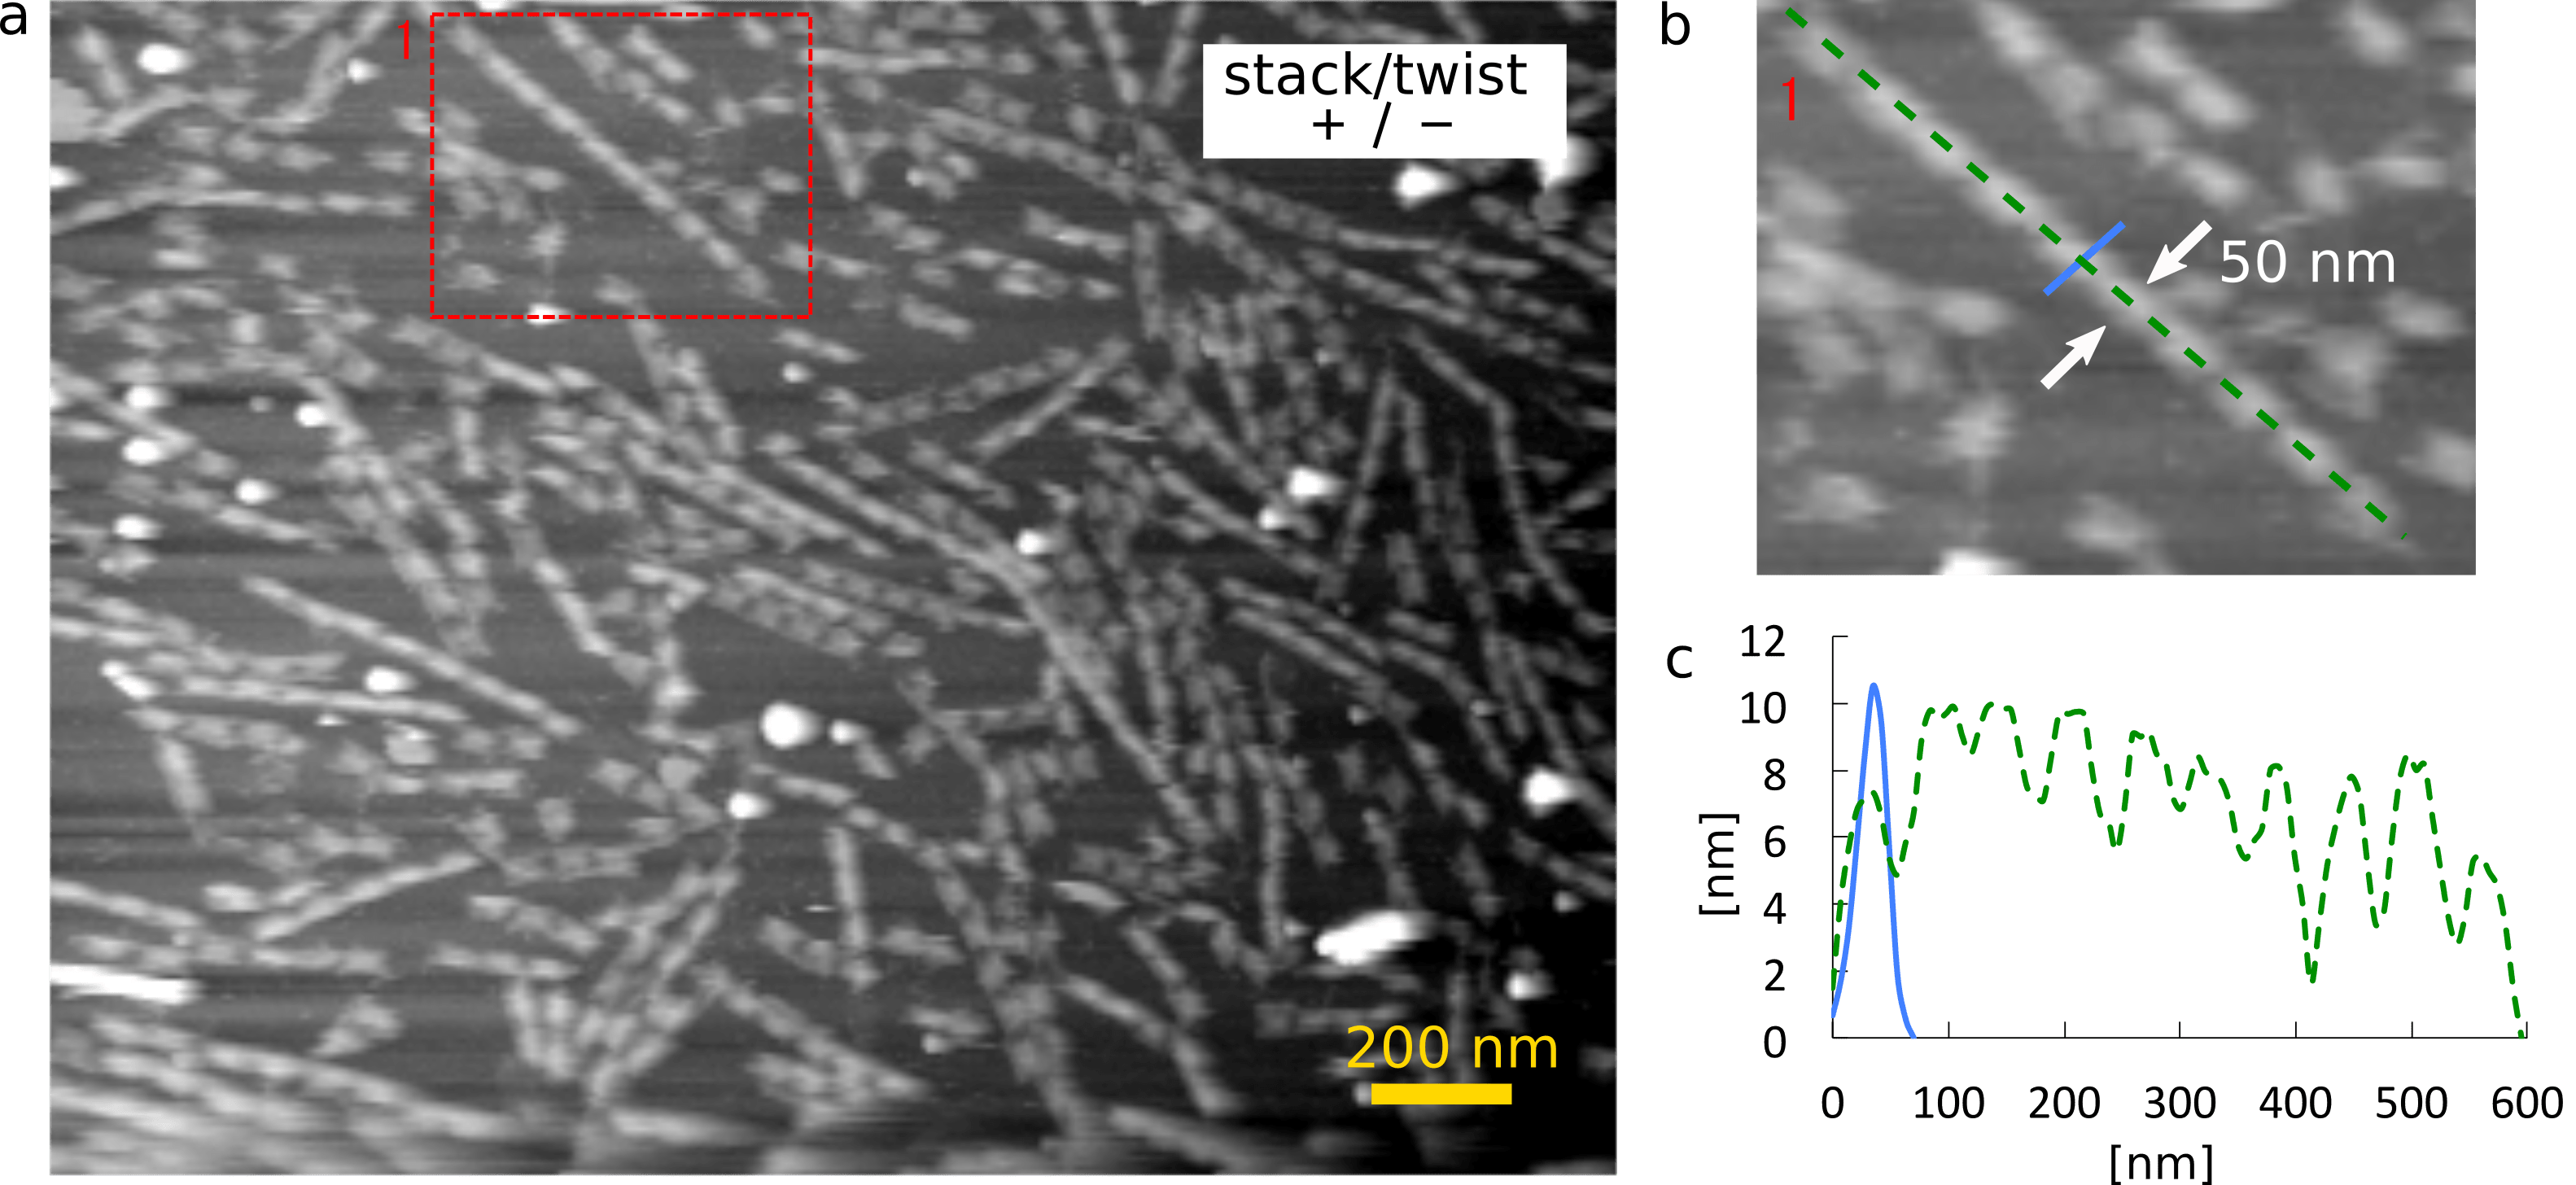
(a) Zoom-out image
(b) Zoom-in image and the size of the monomer
(c) The height of the monomer in the cross section of (b)
Thirdly, we observed the monomer (+/+), which is expected to have a limited number of stack caused by the twist of the shaft.
Fig. 3 shows its AFM image. Here, the number of stacking seems to be smaller compared with that of the monomer (+/-). These results clearly show that our mechanism to control the number of stacking by imposing a twist actually worked.
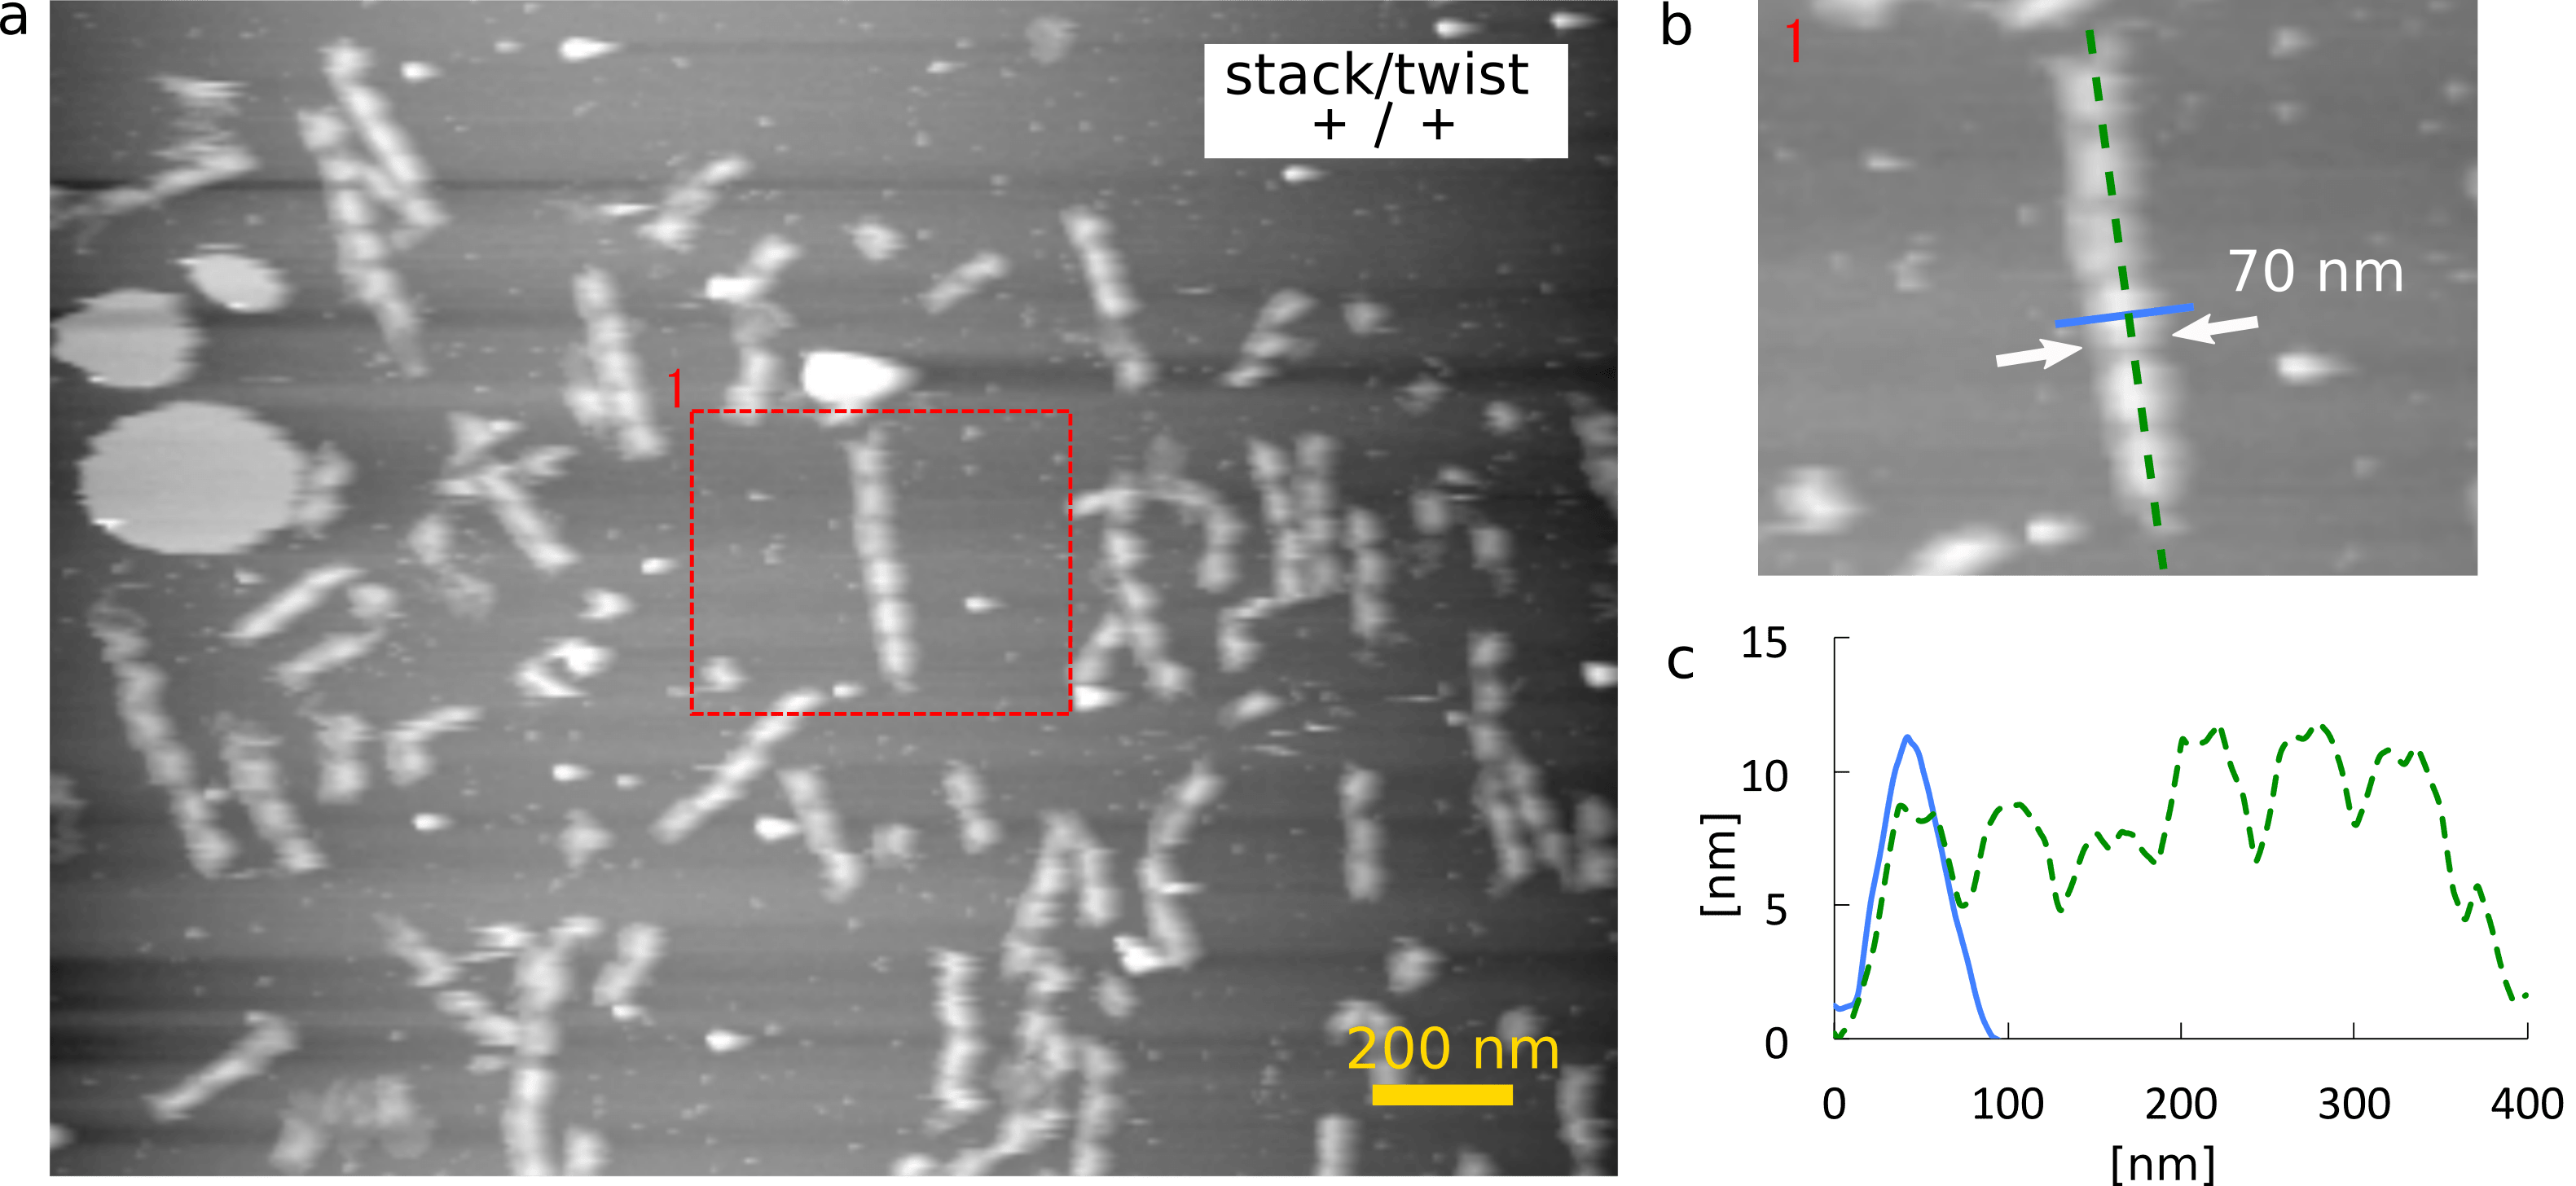
(a) Zoom-out image
(b) Zoom-in image and the size of the monomer
(c) The height of the monomer in the cross section of (b)
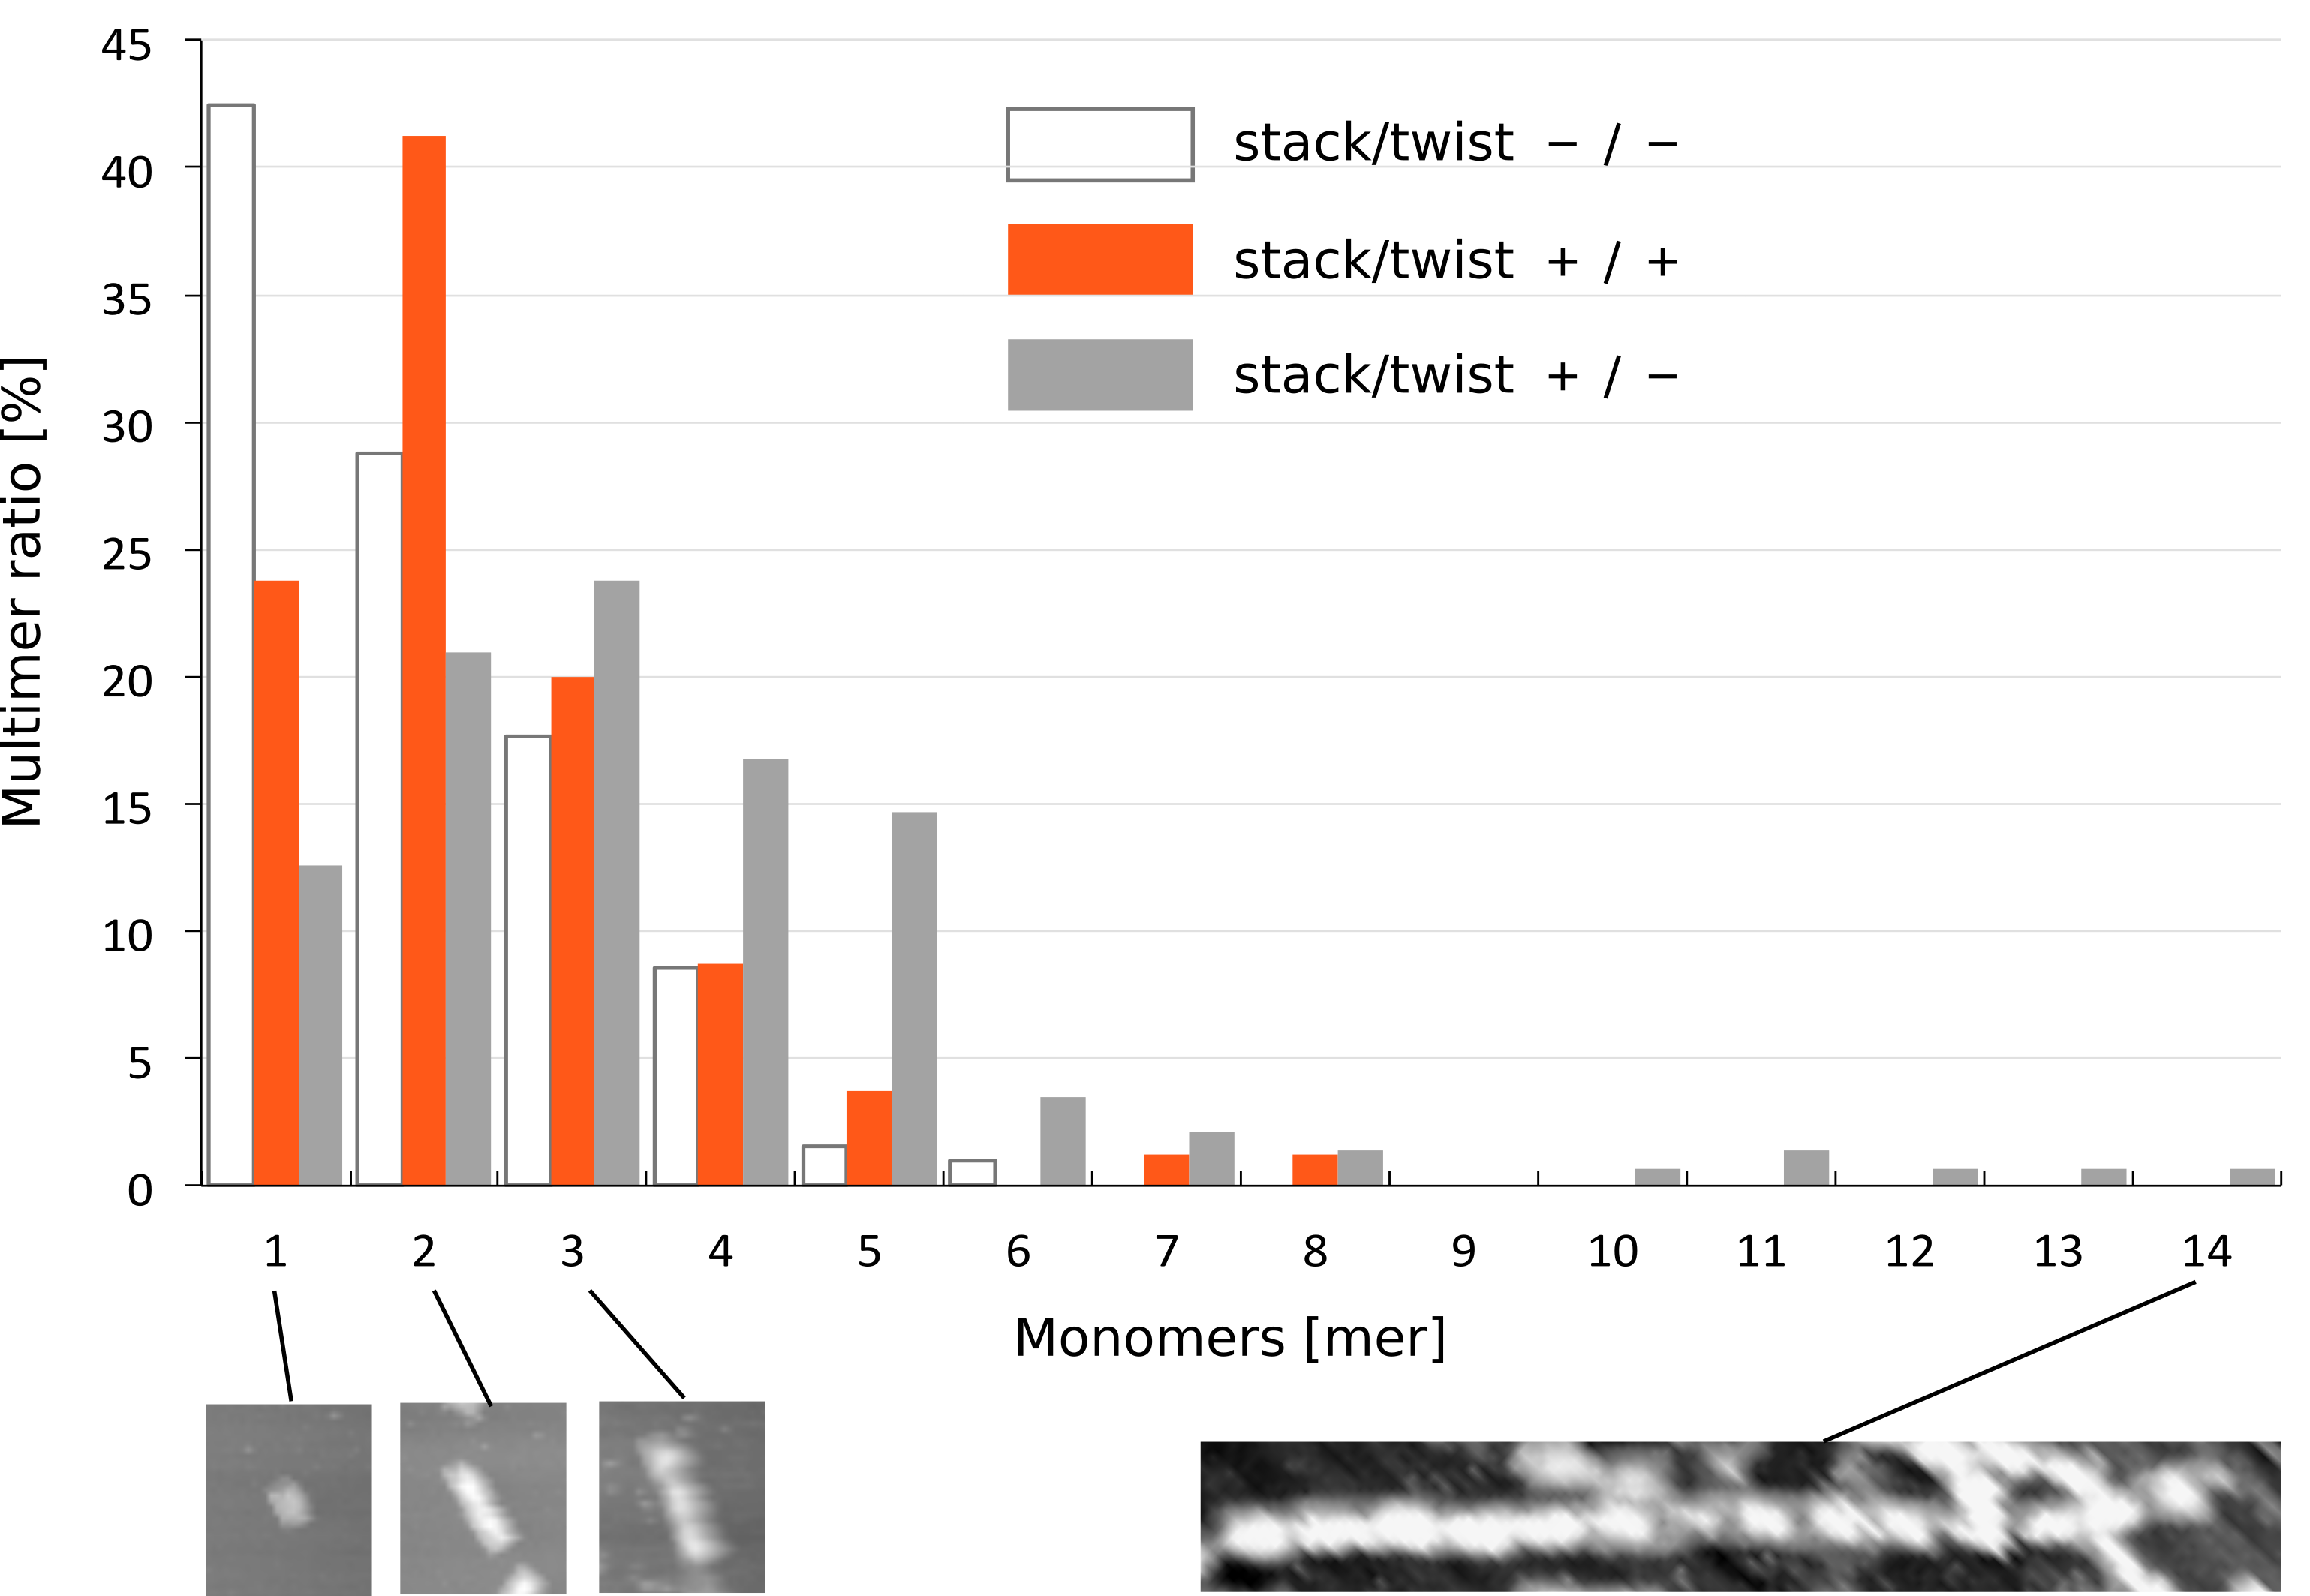
To investigate the effect of stacking and twist, we statistically analyzed the stacking number of monomer (-/-), (+/-), and (+/+) by making histograms (Fig. 4). For each monomer type, the histogram was made from three different AFM images (row data are available at the Material & Method). This data shows that there were different distributions of stacking number among three monomers. Monomer (-/-) tended to exist only by a monomer, while the stacking number of monomer (+/-) was dispersed. In the case of monomer (+/+), most of them formed a dimer, where the longest multimer consisted of 8 monomers. This indicates that the stacking number of monomer (+/+) was limited by a twisted shaft.
Cryo-TEM (Cryo-transmission electron microscopy)
To assure the three-dimensional structure, we observed the monomer by cryo-TEM. Fig.5 is a comparison between the cross-section of the monomer in caDNAno design and cryo-TEM images. The cryo-TEM images were reconstructed from multiple raw data using component analysis (detail in Material & Method). The diameter of the hollow cylinder and the shaft were 18 nm and 5.7 nm in Fig.5-b, and 18 nm and 6.5 nm in Fig. 5-c. This size is in good agreement with the caDAno design. Therefore we concluded that the monomer structure was properly formed.
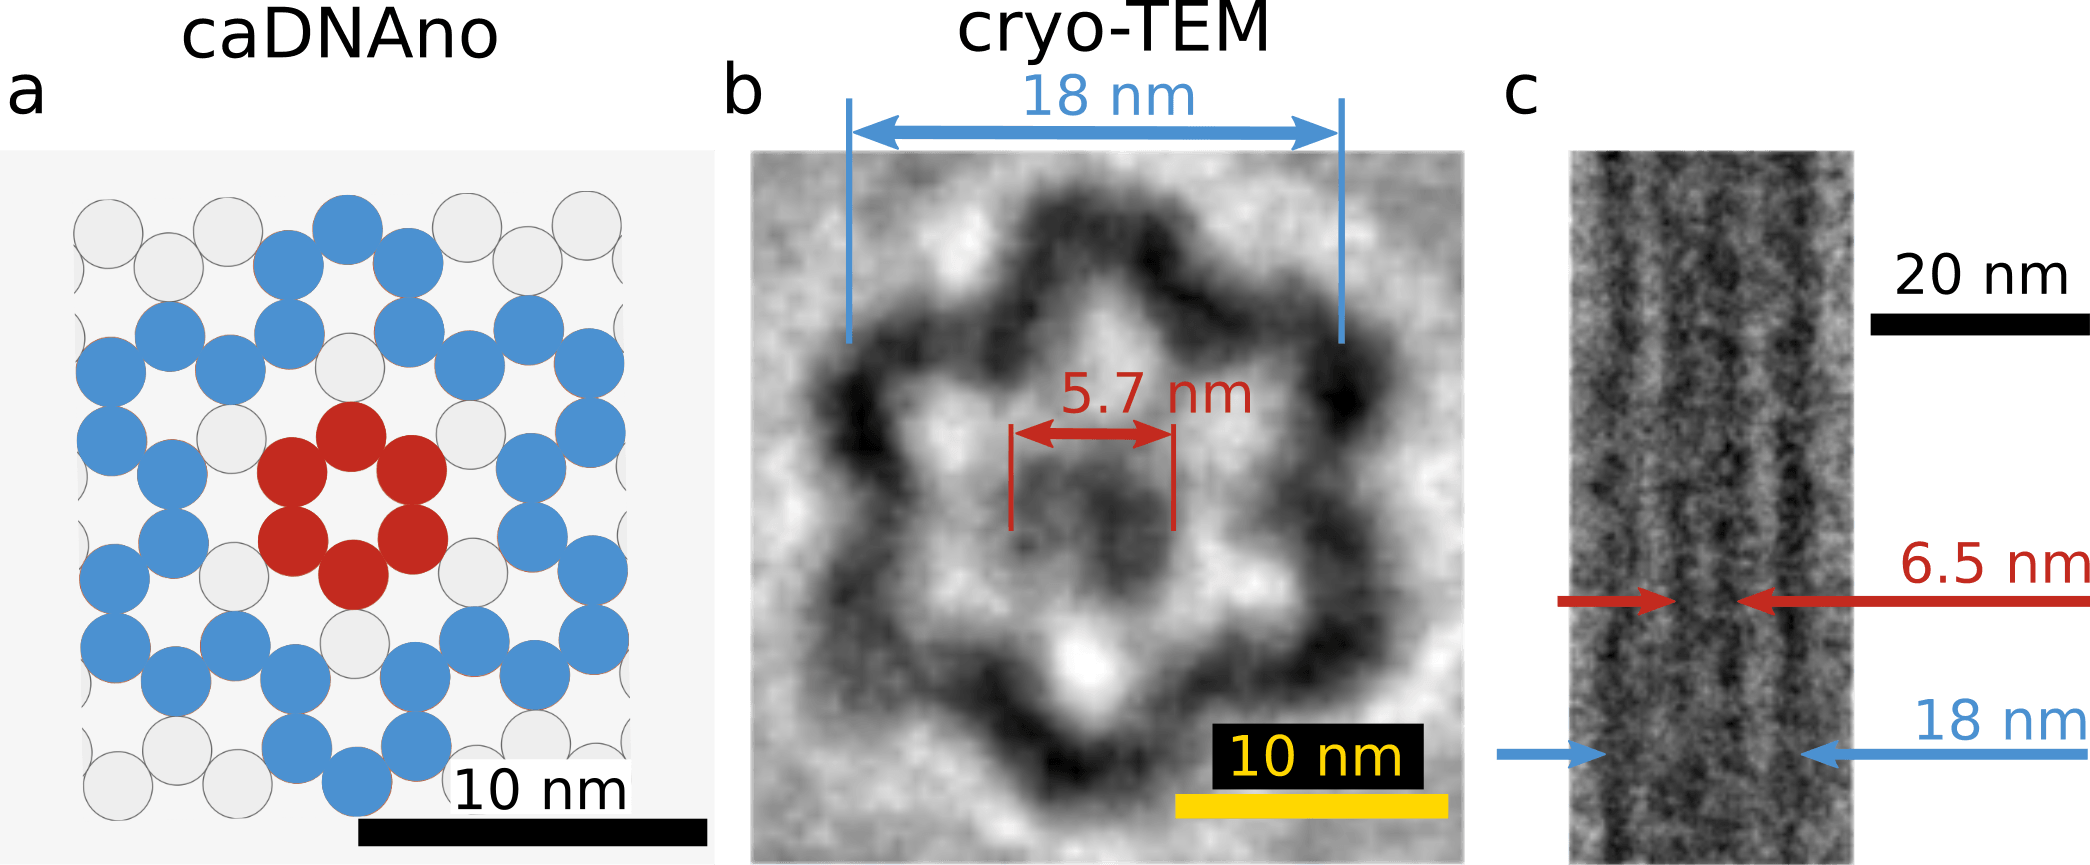
(a) caDNAno design
(b) Recovered cryo-TEM image in cross section
(c) Recovered cryo-TEM image (longitudinal section)
We observed extremely longer homomultimer in cryo-TEM compared with AFM, which may be because the force from cantilever and adsorption to substrate were eliminated.
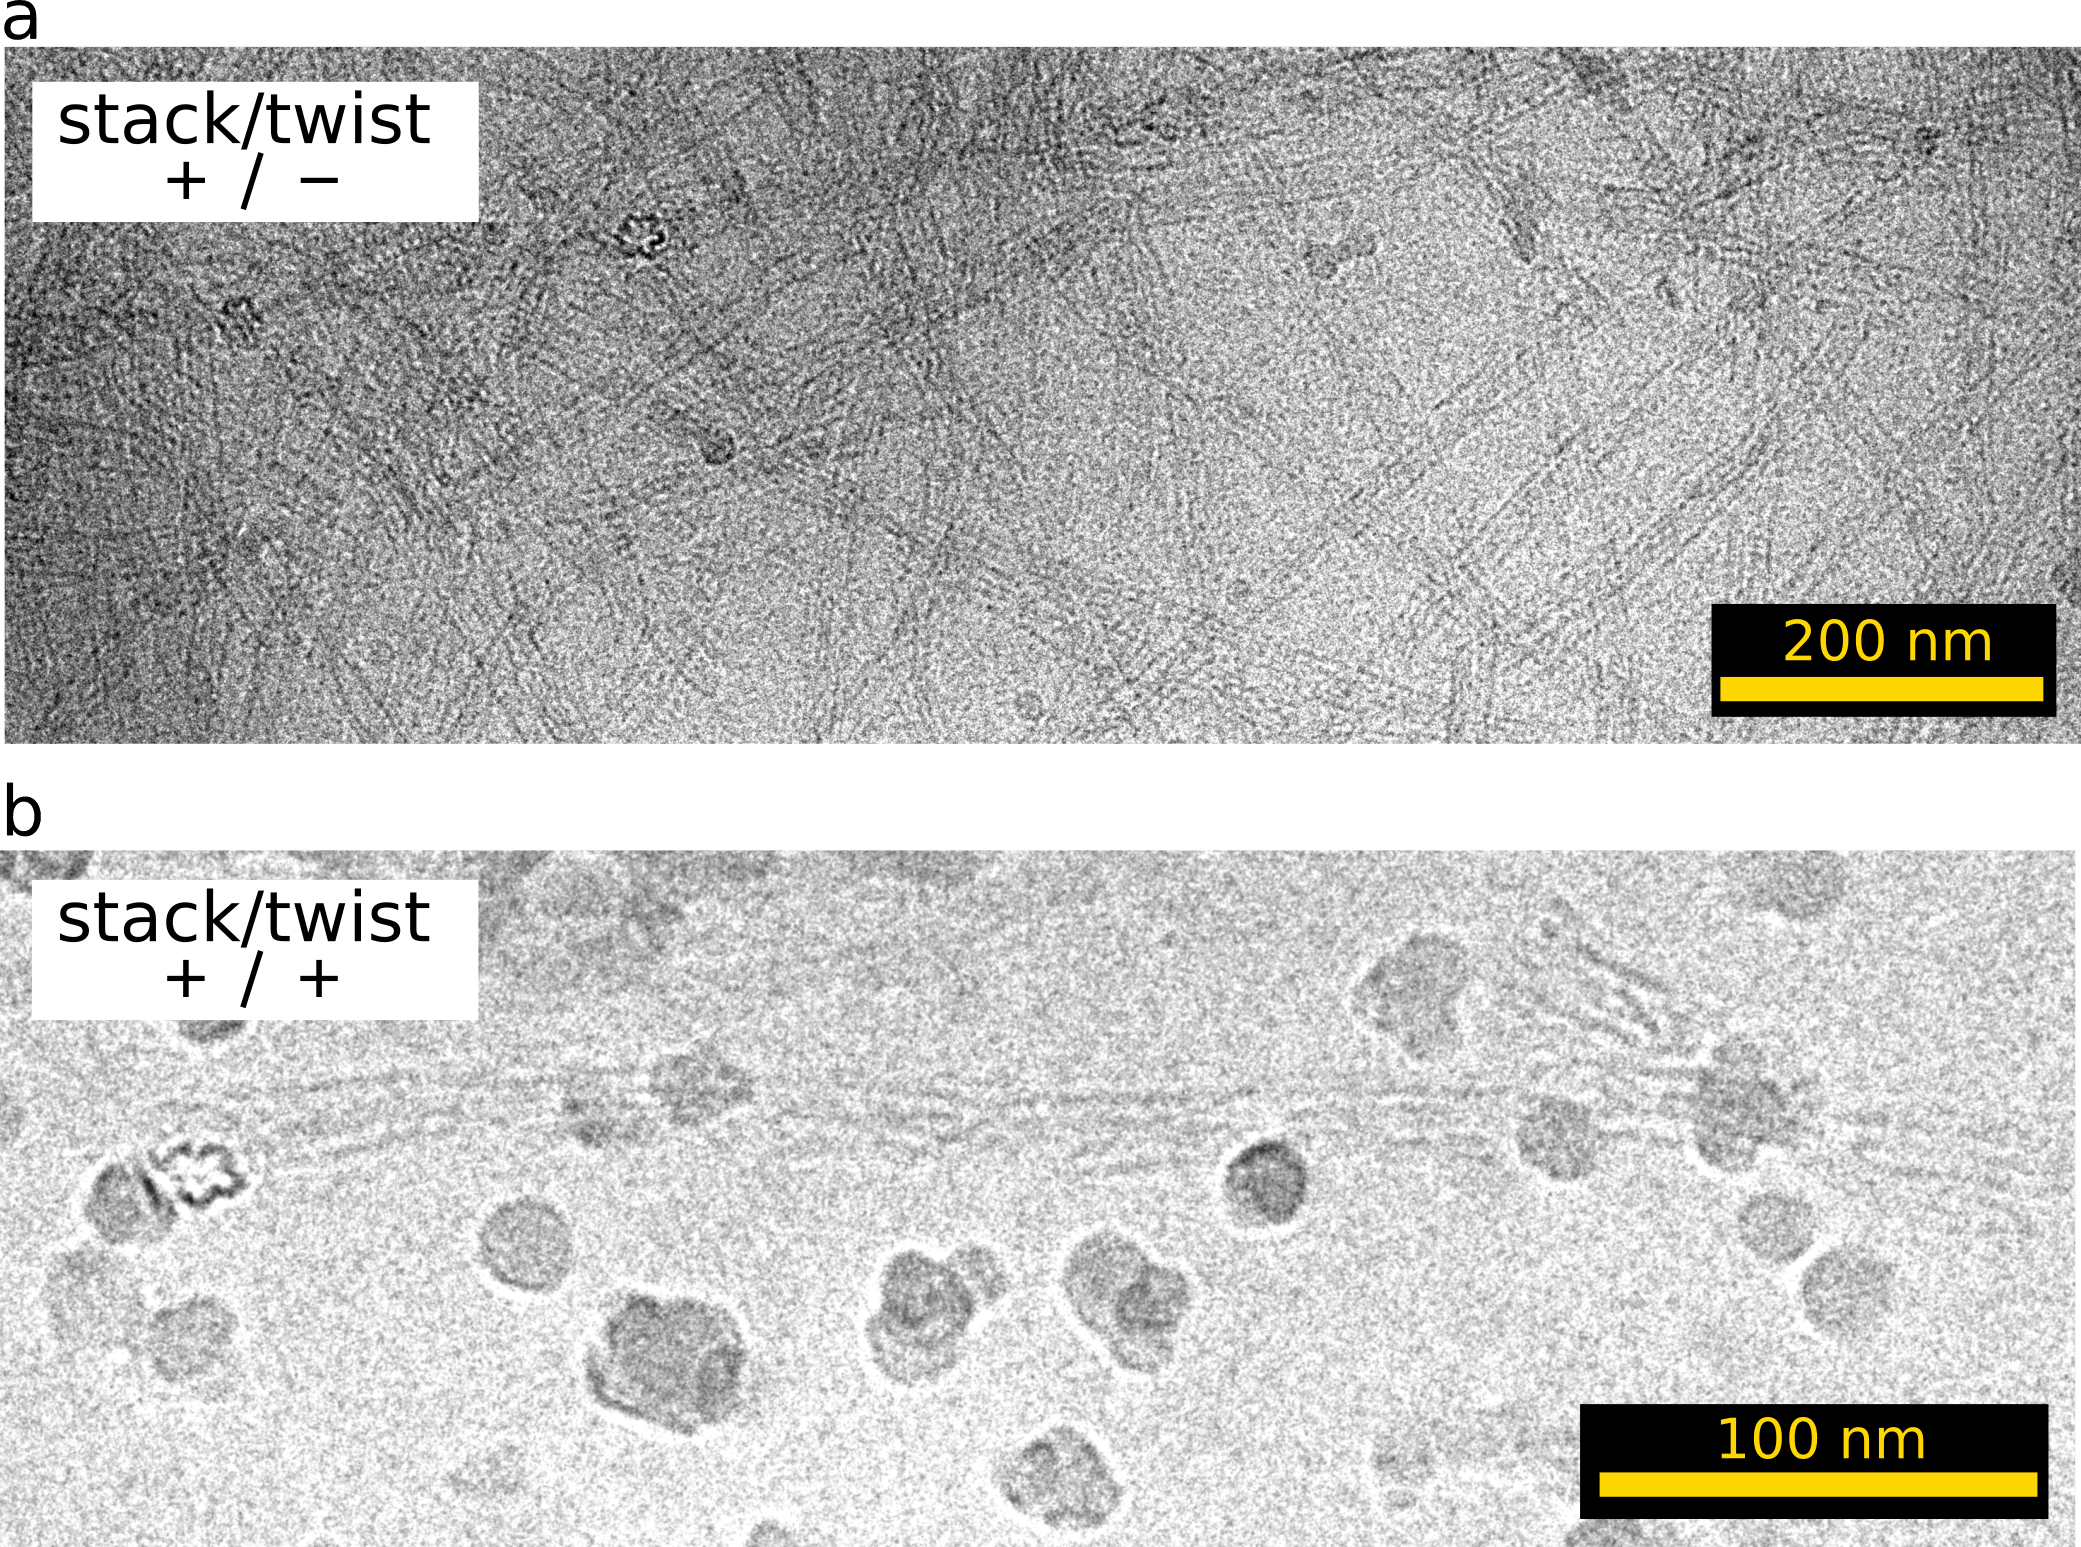
(a) Recovered cryo-TEM of homomultimer
(b) cryo-TEM result(contrast optimized) of linear homomultimer
Analysis of Stacking
To identify the ability of stacking, we checked the stacking angle of 3 different samples, (monomer (+/+), (+/-), and (-/-)) from the AFM images. In Fig. 7, each straight line shows the central part of DNA origami structure, and the angular deviation is evaluated. As a result, the angle of monomer (-/-) was larger than that of monomer (+/+) and (+/-). This may indicate that monomer (-/-) bound each other by imperfect stacking between cylinders.
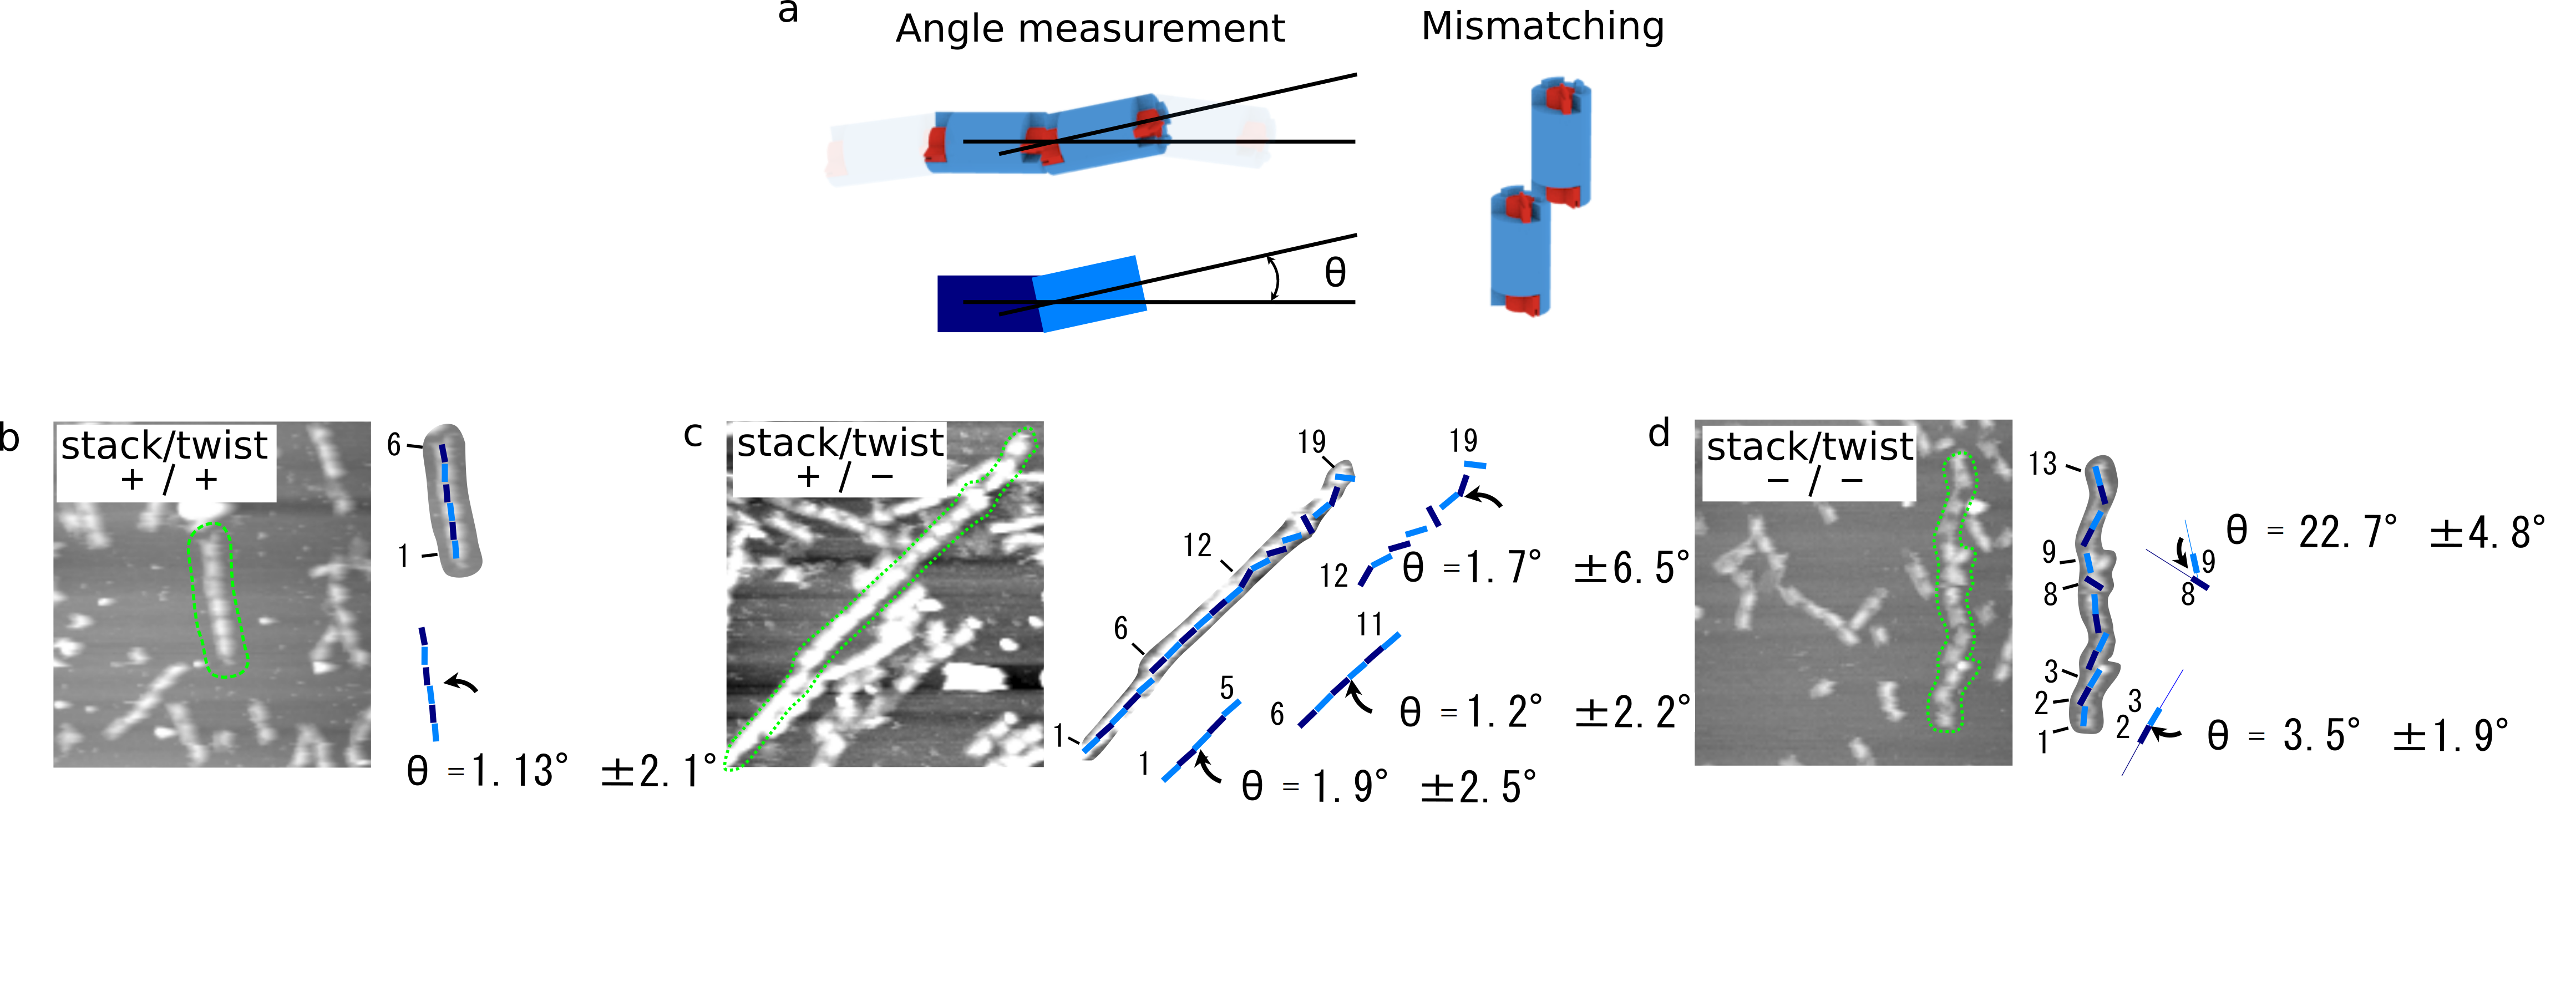
(b)monomer(+/+)
(c)monomer(+/-)
(d)monomer(-/-)
Optimizing Staple Concentration
To optimize the yield of complete monomers that have a shaft inside, we need to adjust the concentrations of M13(M), cylinder staple (C), and shaft staple (S). The yields of monomers were evaluated based on the height of the AFM image. In the case of M:C:S=1:25:50, the yield was around 40% (Fig. 8-a). In contrast, the yields improved to 95% for the ratio 1:10:50 (Fig. 8-b), which we employed for the experiments.
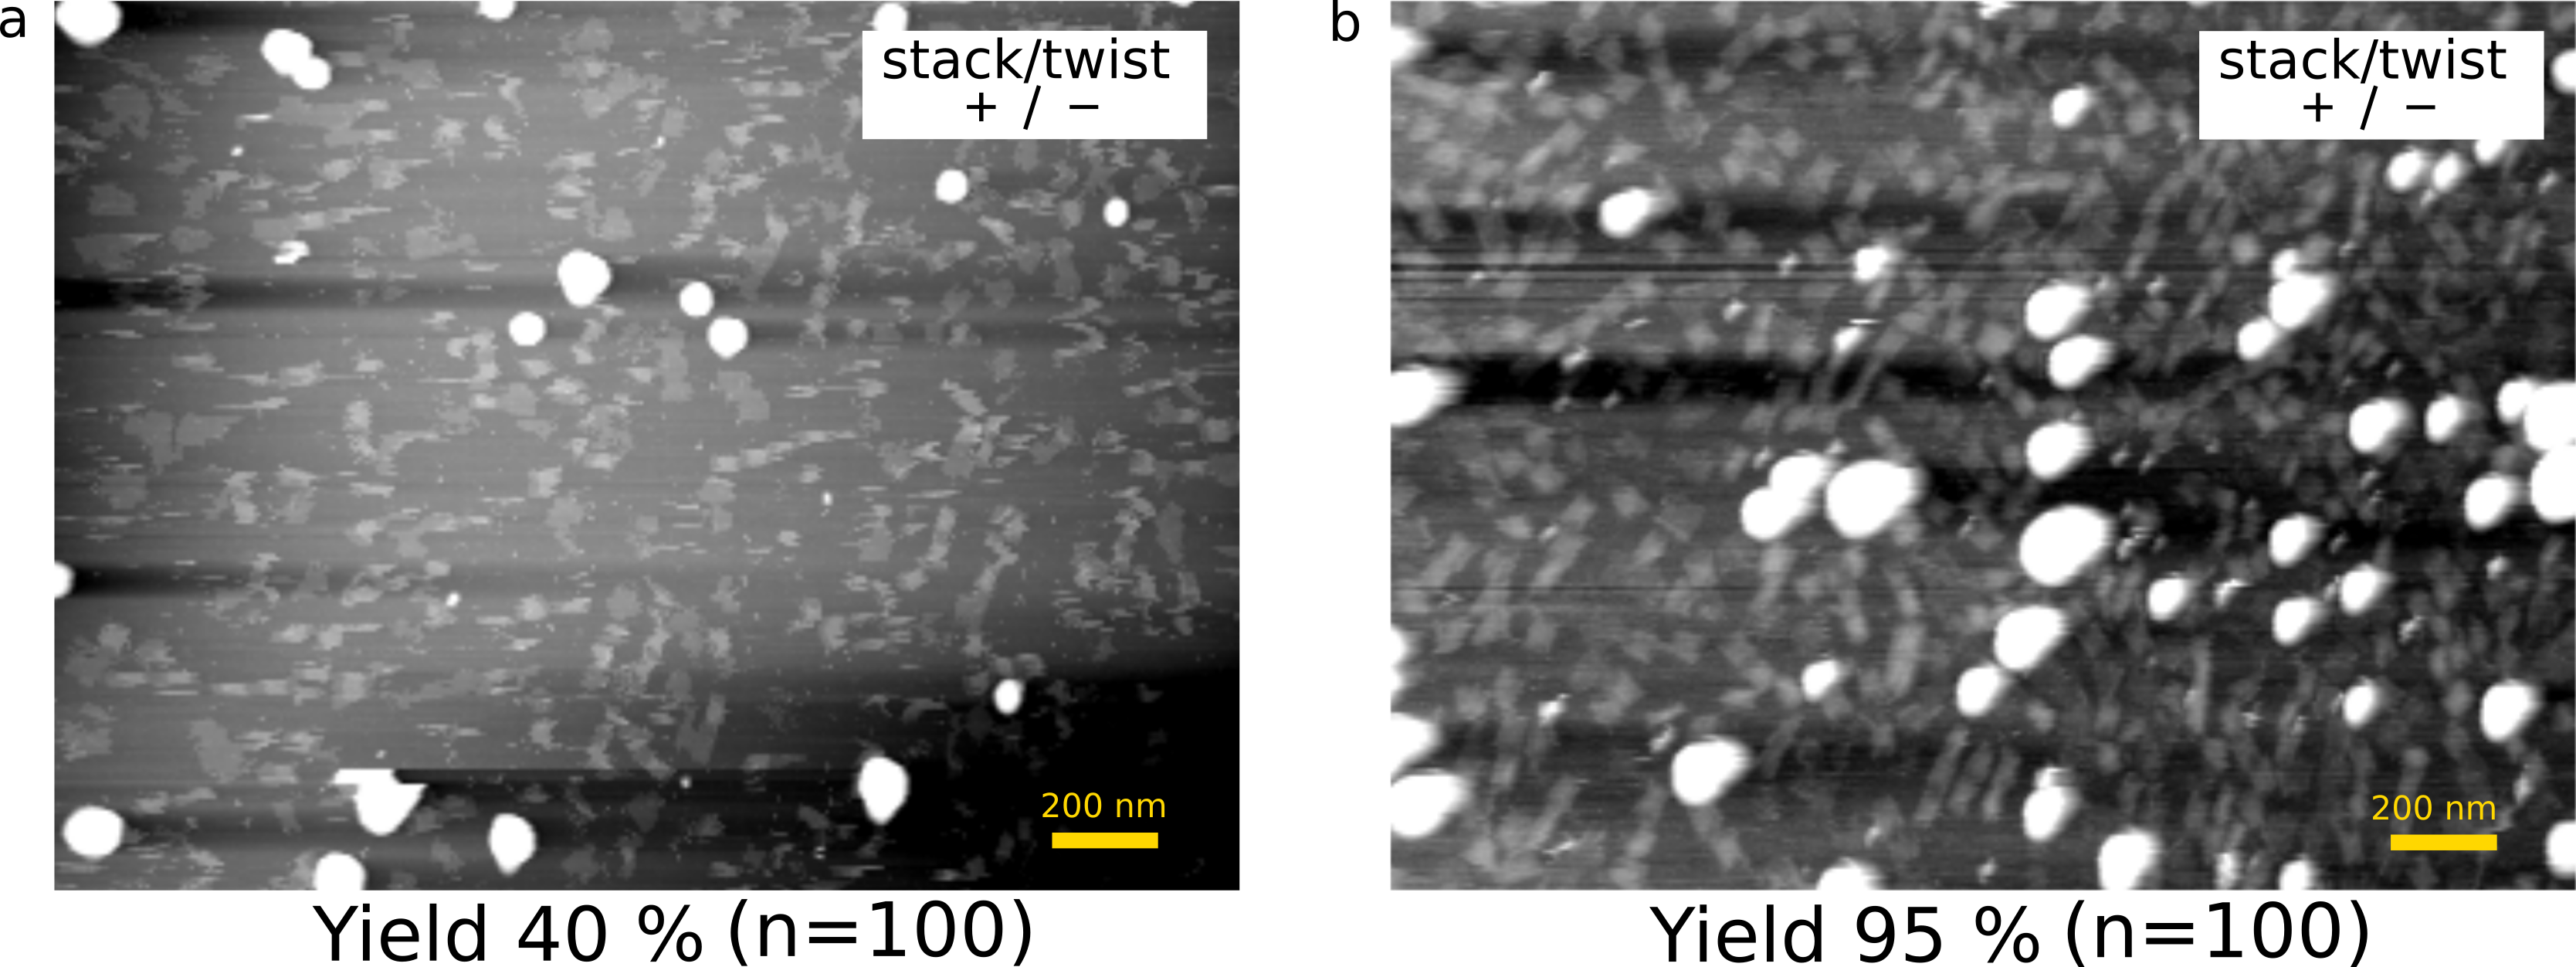
(a) M:C:S=1:25:50
(b) M:C:S=1:10:50
Annealing Condition
We also need to tune the annealing profile (Fig. 9). We tried profiles of Fig. 9-a, 9-c first. By the profile of Fig. 9-a, the cylinder was formed but we could not find shafts, because the time of annealing was too short to form a three-dimensional shape (Fig. 9-d). By the profile in Fig. 9-c, there were also no monomers that formed as we desired. The overlong annealing seemed to induce unexpected DNA reactions. On the other hand, as shown in Fig. 9-e, the deisired monomers were clearly observed in high yield. By the profile in Fig. 9-b, we optimized the condition of the buffer and the ratio of the staple concentration in order to construct monomers and multimers. Therefore, we used this condition in all analytical experiments.
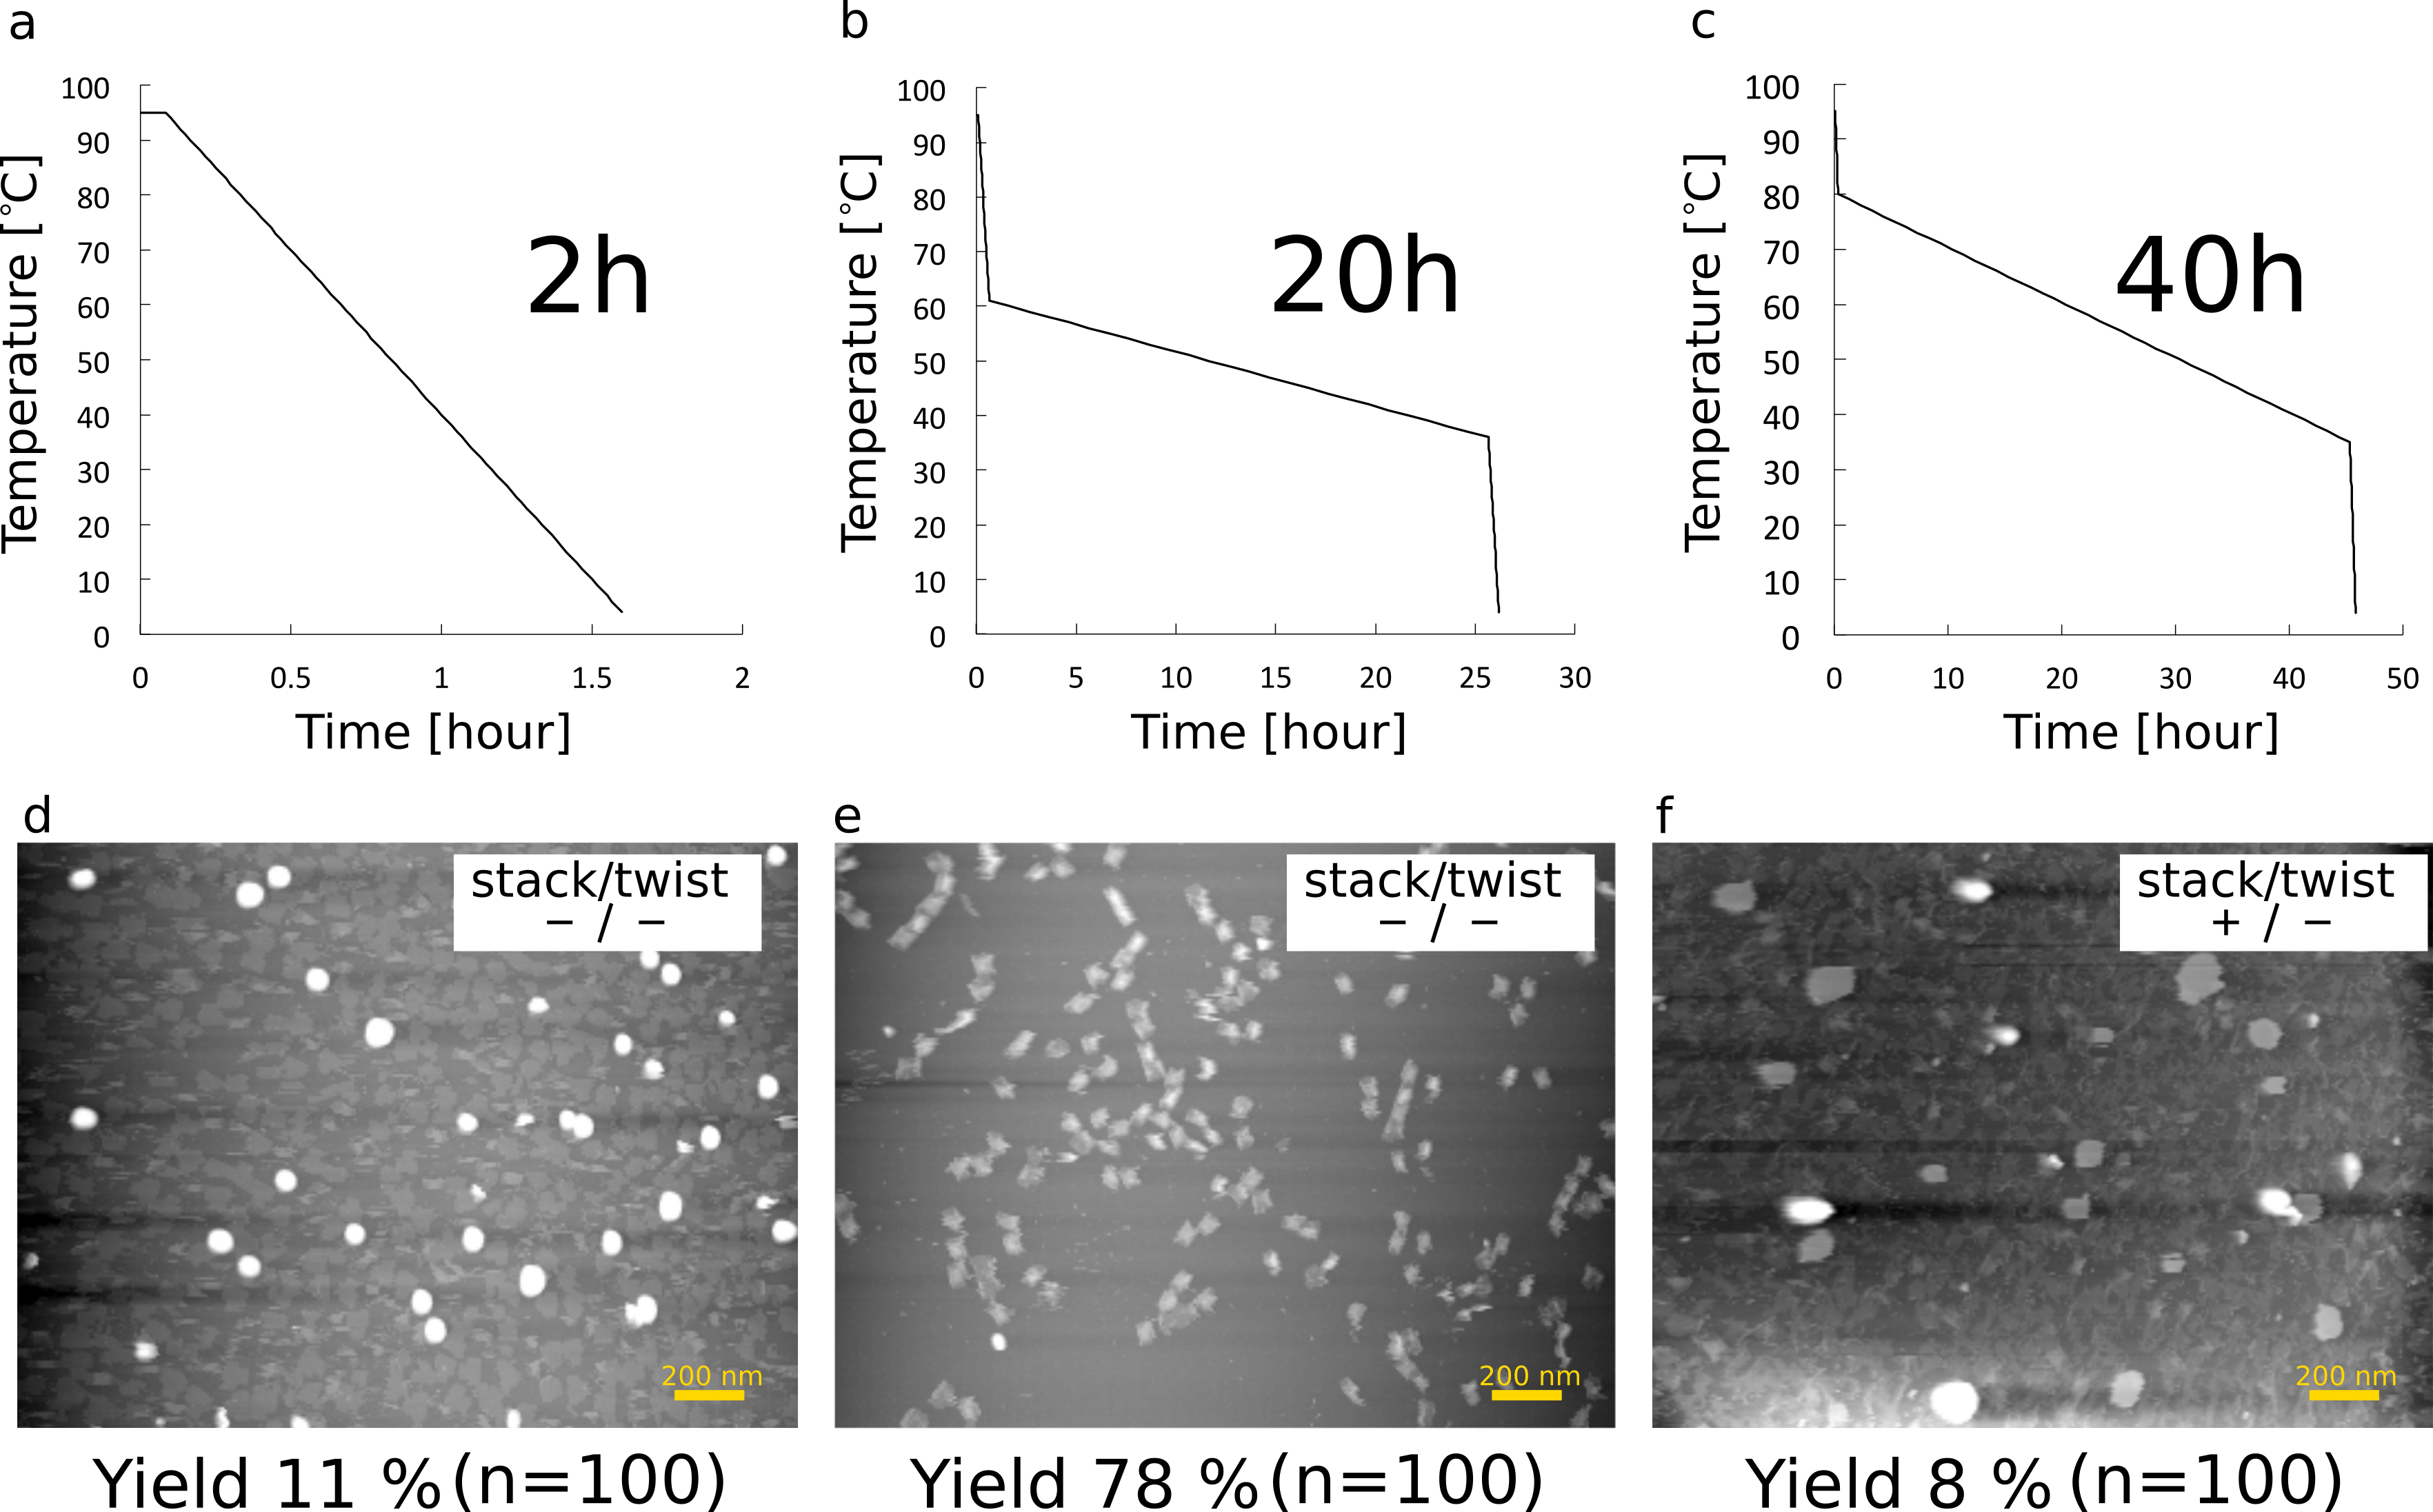
(a) Annealing profile (2 hours)
(b) Annealing profile (20 hours)
(c) Annealing profile (40 hours)
(d) monomers annealed for 2 hours
(e) monomers annealed for 20 hours (The buffer and the ratio of staple concentration were optimized.)
(f) monomers annealed for 40 hours
Gel Electrophoresis
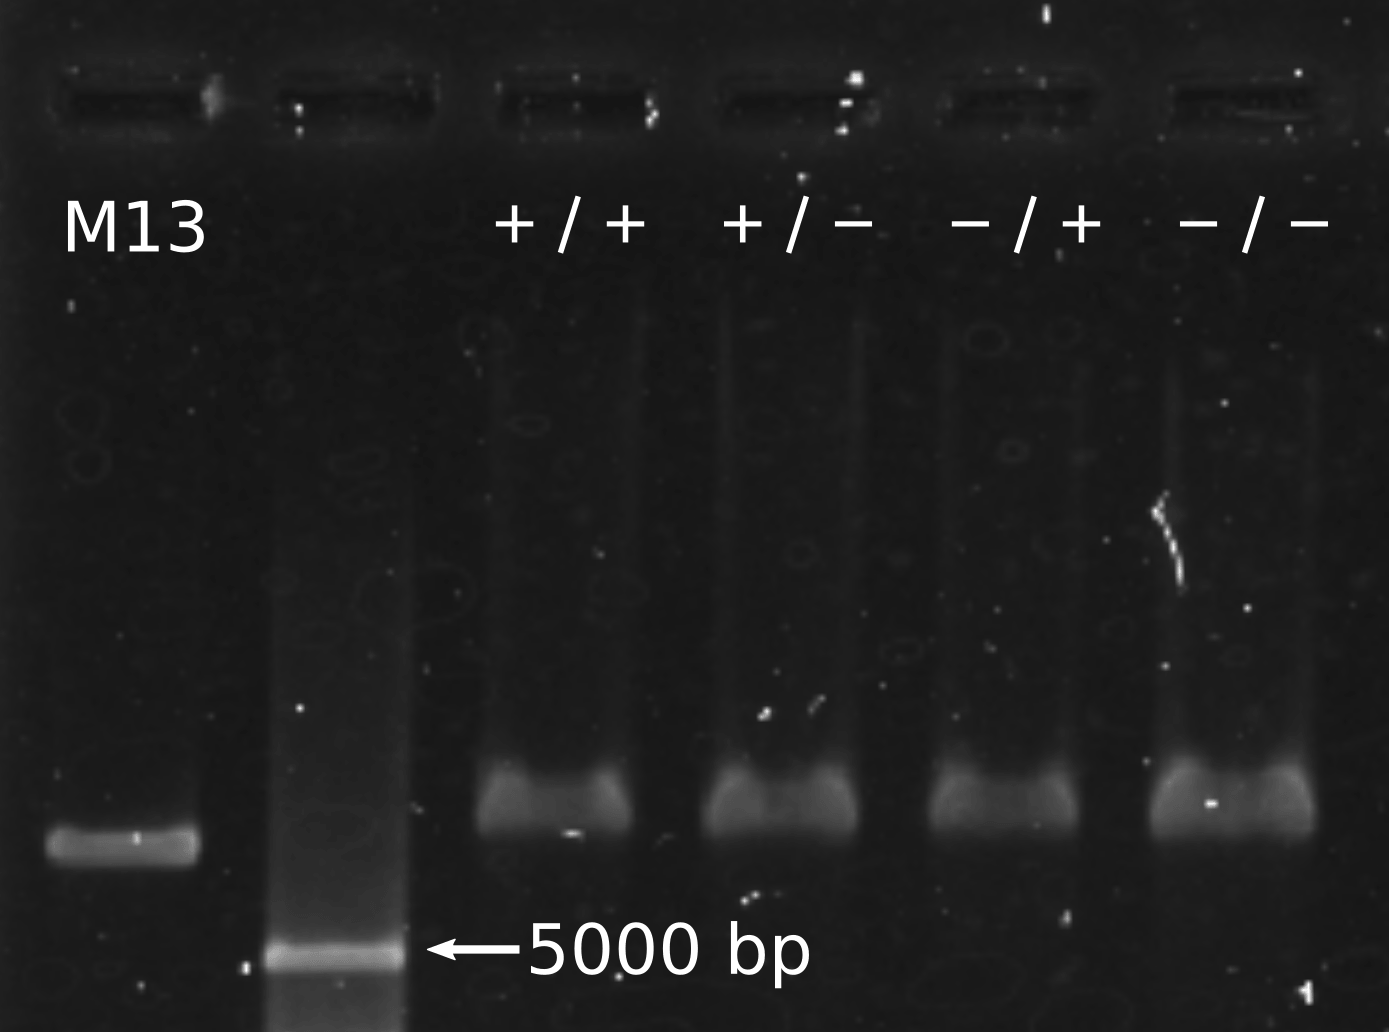
We conducted gel shift assay in order to evaluate the size of structures (Fig. 10). There was a clear difference in bands between DNA origami structures and M13mp18, which verified the construction of the structure. On the other hand, monomer (+/+) and (+/-) were supposed to form multimers, but we could not find major difference in the bands between monomer (+/+), (+/-) and monomer (-/+), (-/-). It suggests that the stacking between monomers was too fragile to keep binding each other during gel electrophoresis. The multimers may be caught in the mesh of gel and broken into monomers.