Material & Method
Protocol
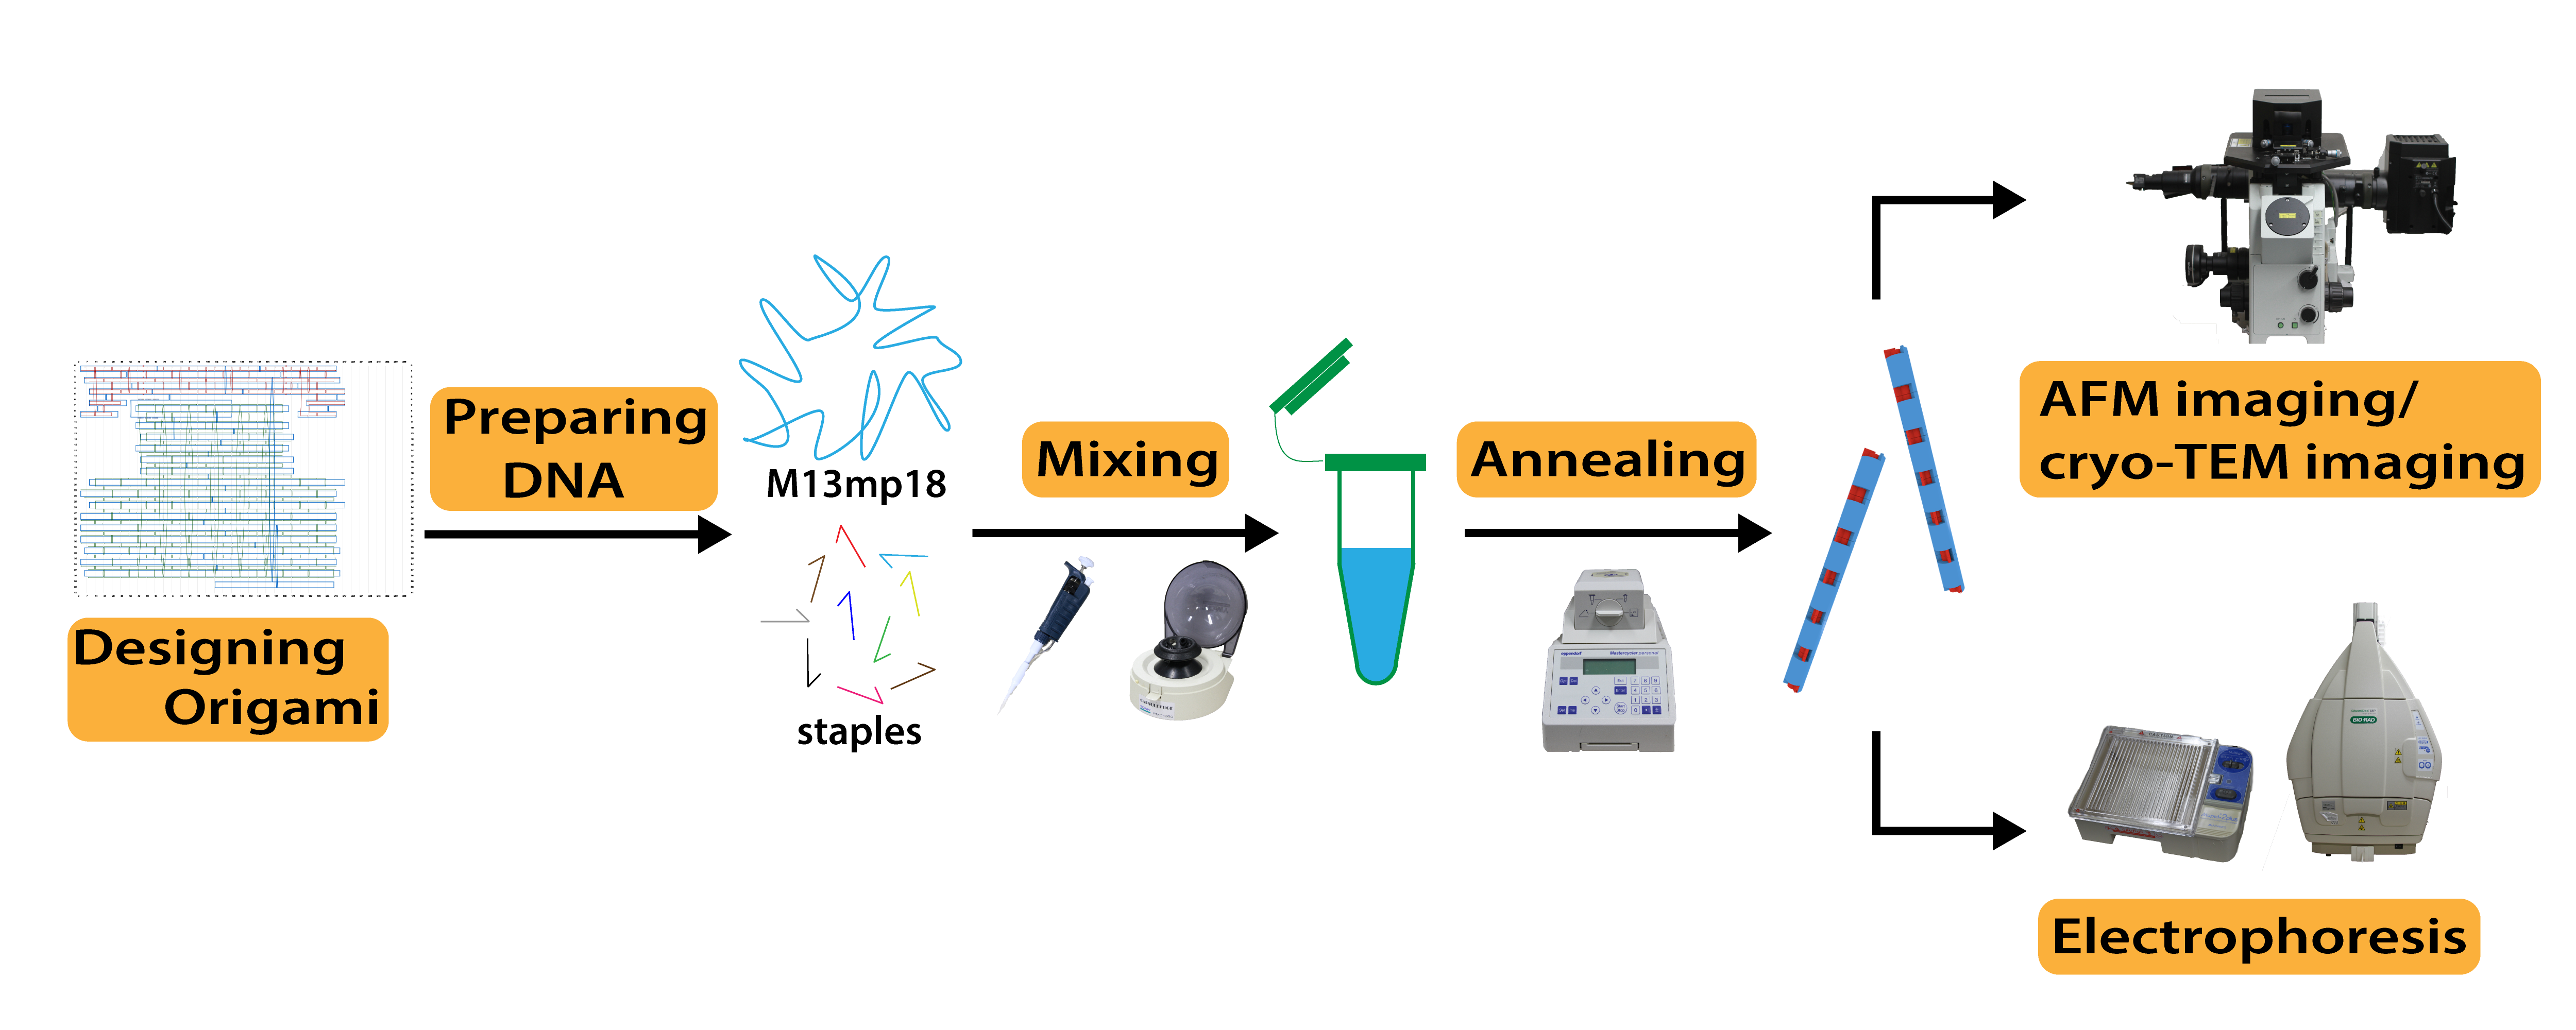
Fig. 1 shows a brief outline of our experiments.
Origami Design
We designed four types of origami by using caDNAno. Their schematics are summarized in Fig. 2. In addition, source codes of the designs in json format are available in the lists below.
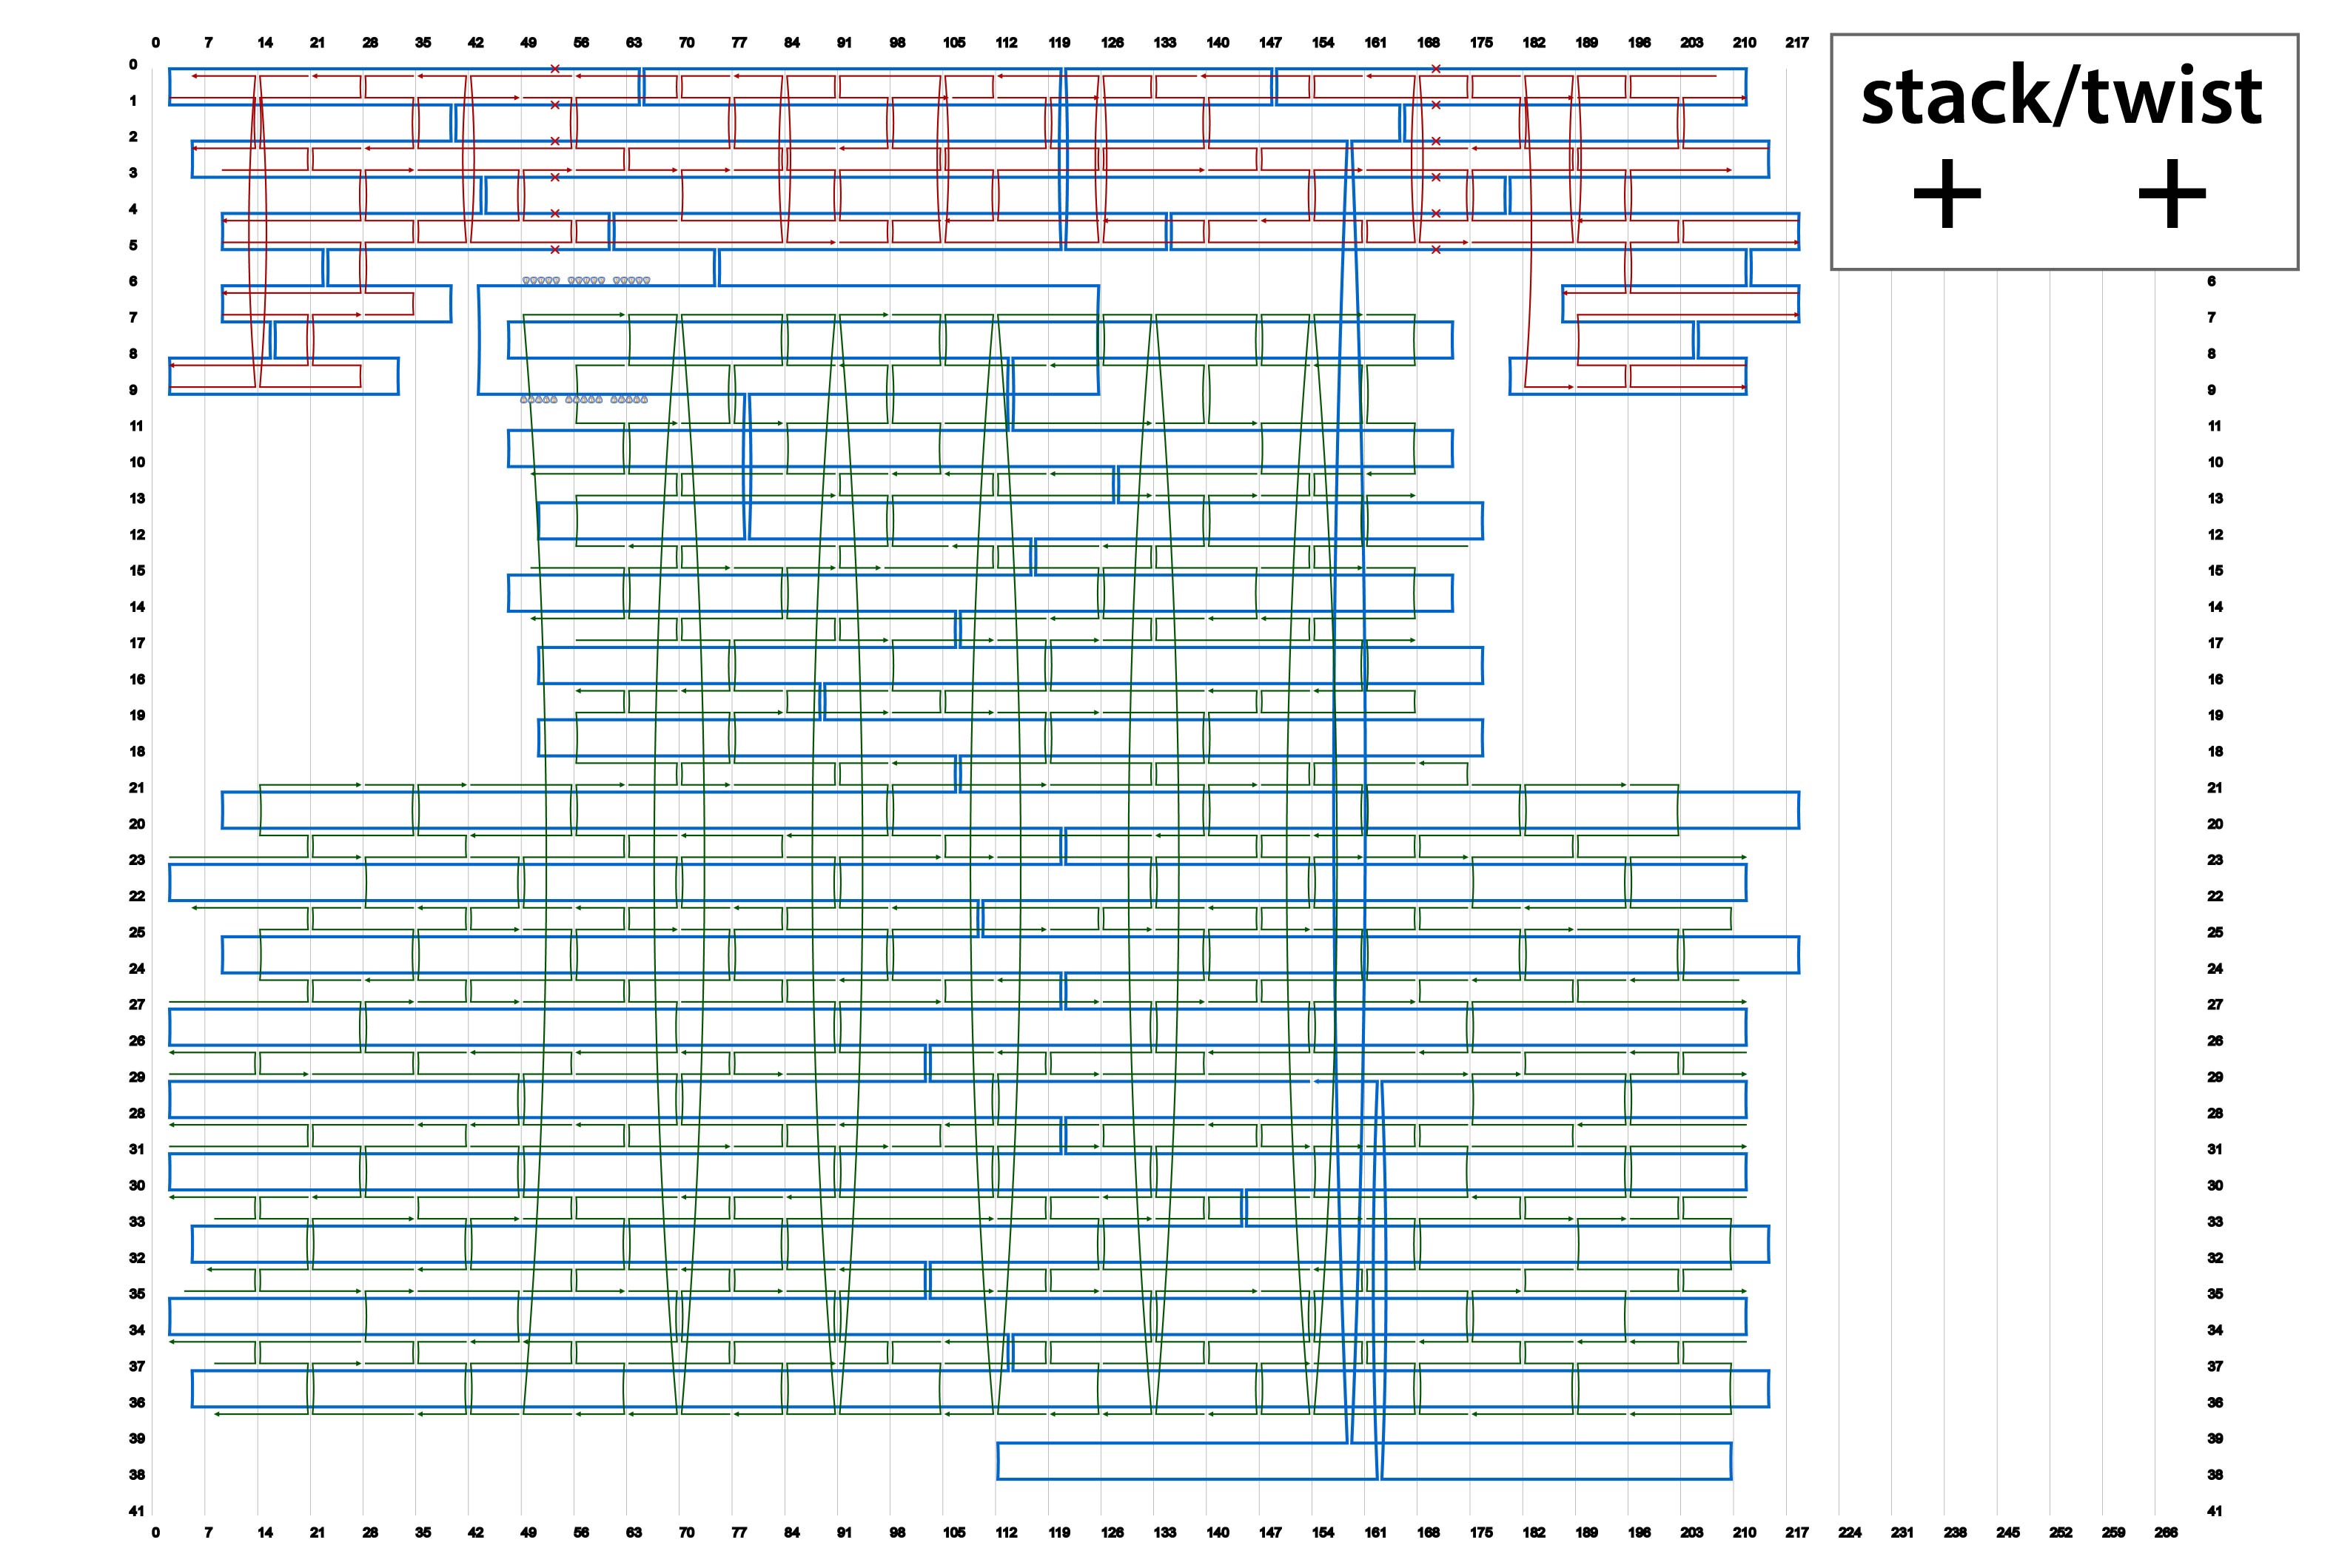
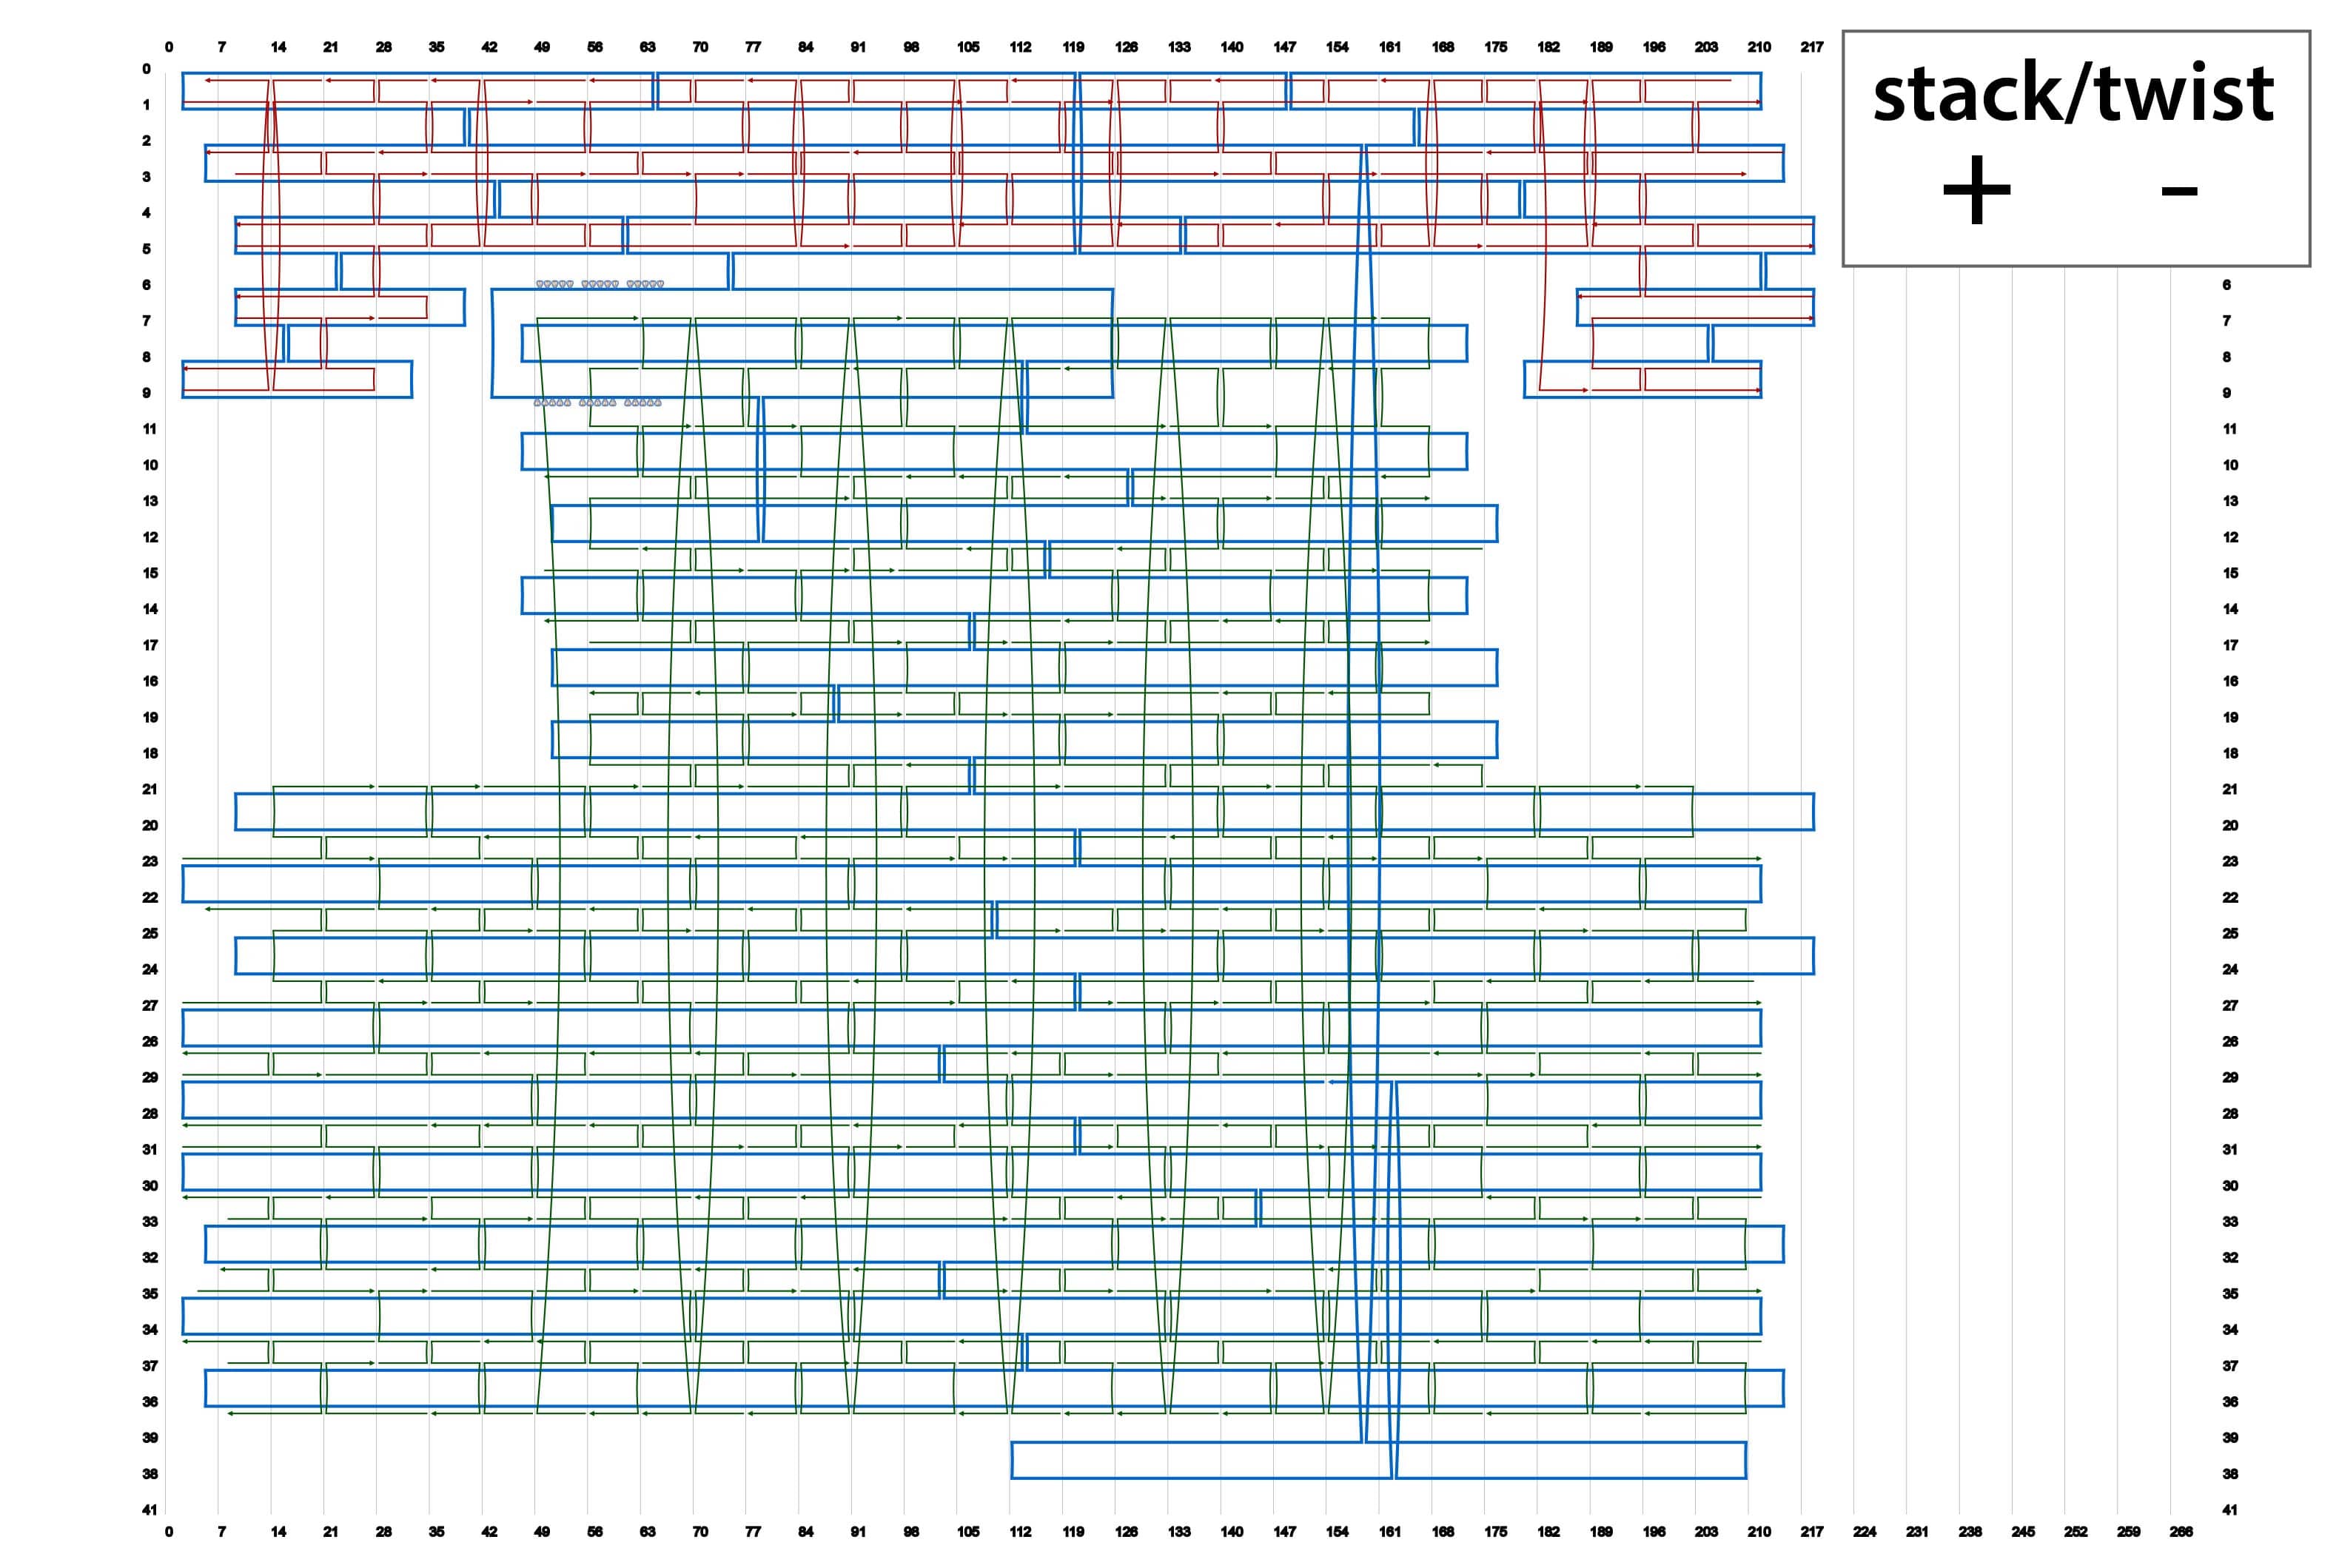
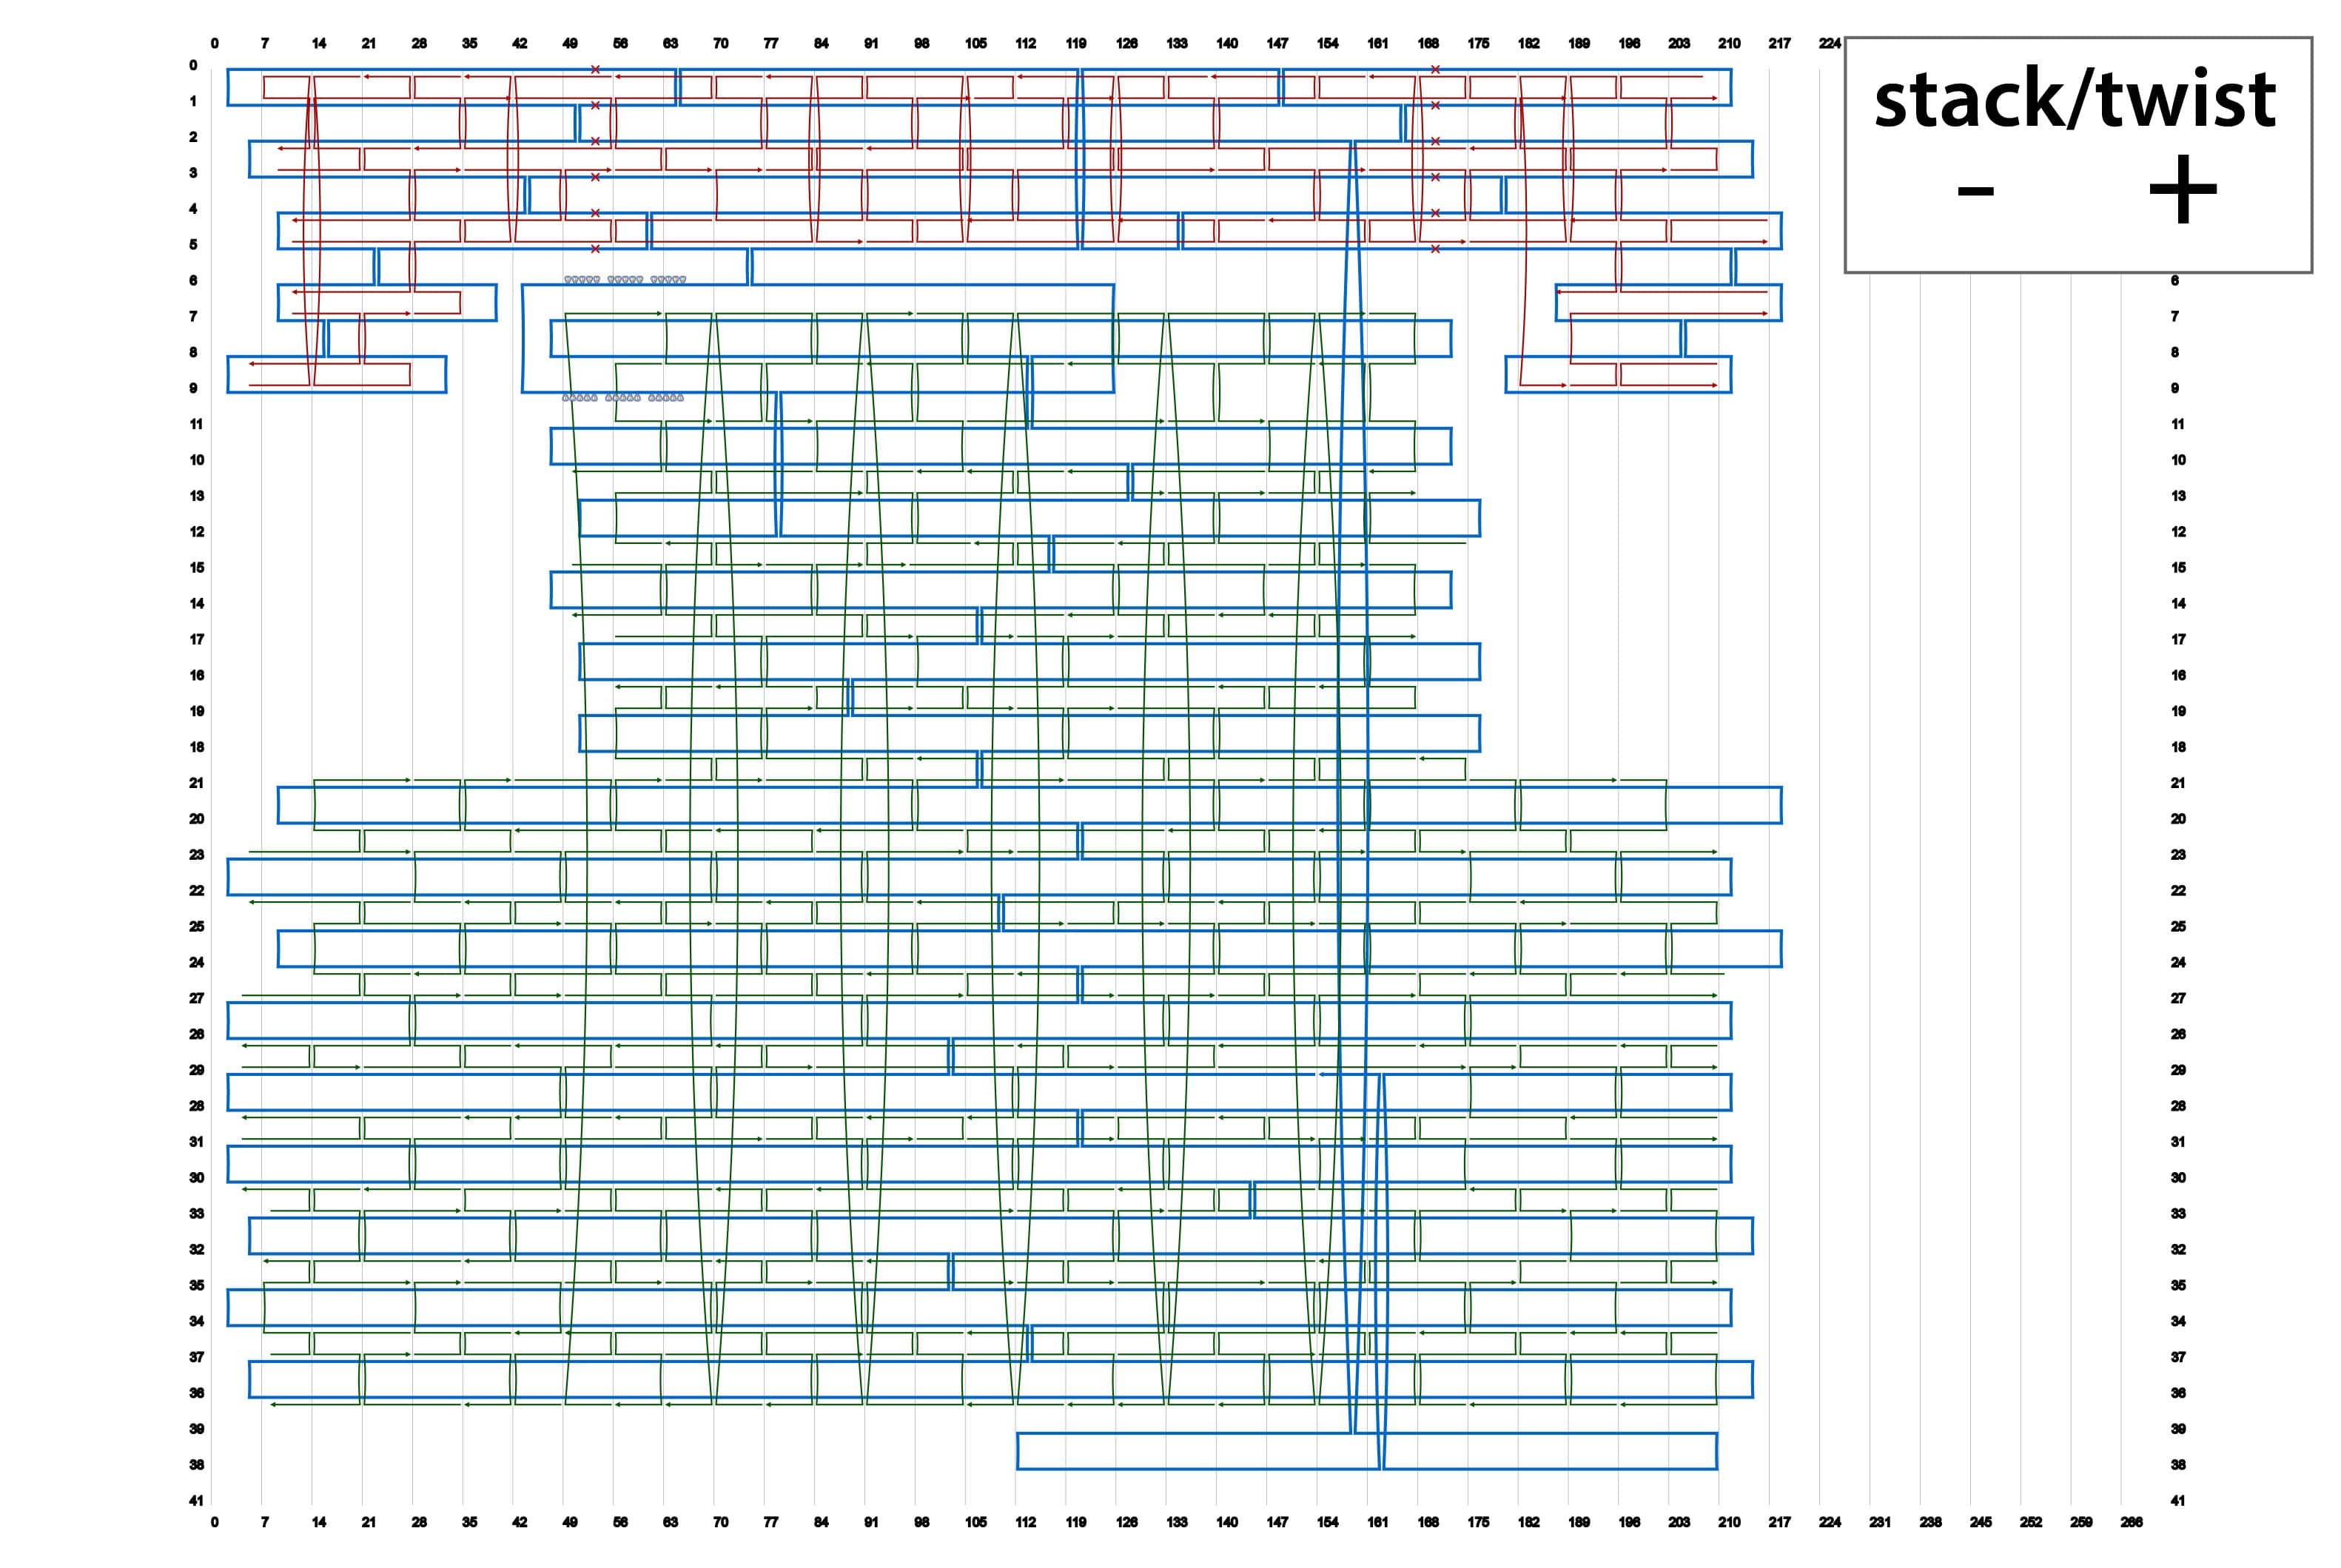
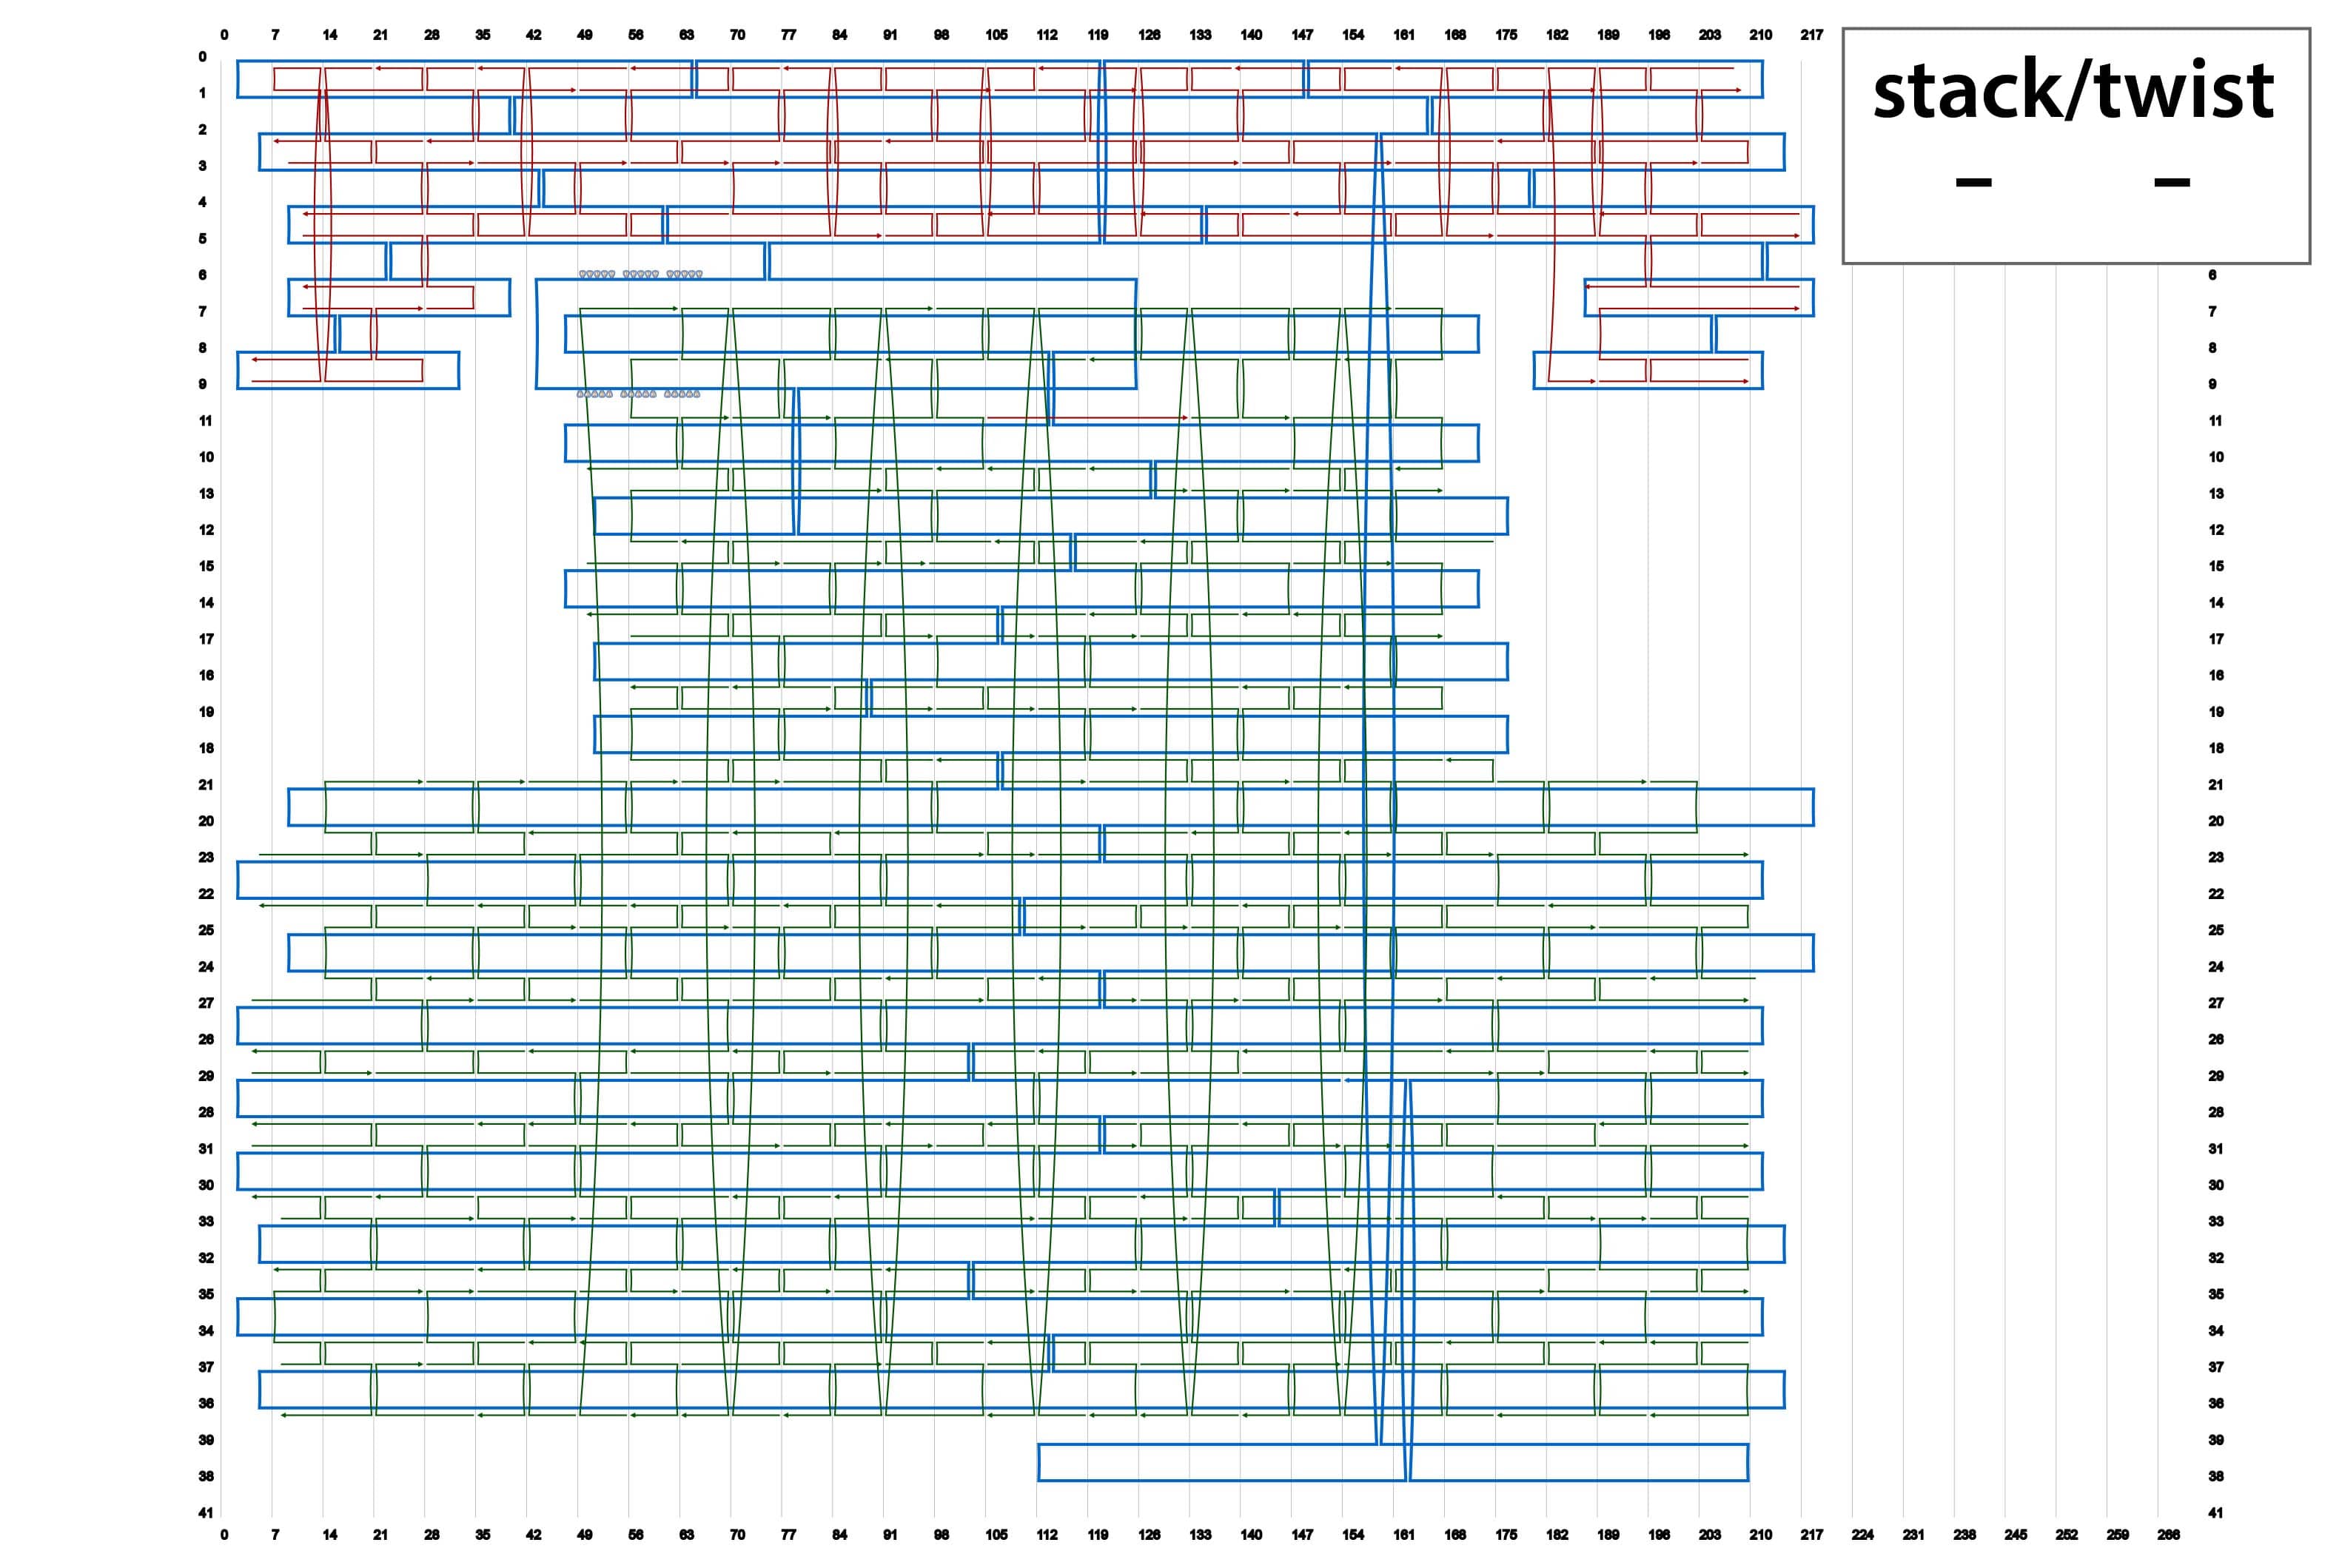
By using different sets of Shaft-staples, it is possible to change the angles of the shaft. This time, we prepared four sets of staple strands for the shaft. here.
Sample Preparation
1.Mixing
Our DNA origami samples were prepared by mixing a stoichiometric quantity as shown in Table 1.
| Final Concentration | |
|---|---|
| Shaft Staples | 100nM |
| Cylinder Staples | 20nM |
| M13mp18 | 2nM |
| Buffer | 1×TAE/SEA |
SEA buffer contains a mixture of irons, Na+, Mg2+, Ca2+
To find out the most suitable condition, we changed the proportion of concentration.(Table 2)
| Final Concentration | |
|---|---|
| Shaft Staples | 100nM |
| Cylinder-Staples | 50nM |
| M13mp18 | 2nM |
| Buffer | 1×TAE/Mg2+10mM |
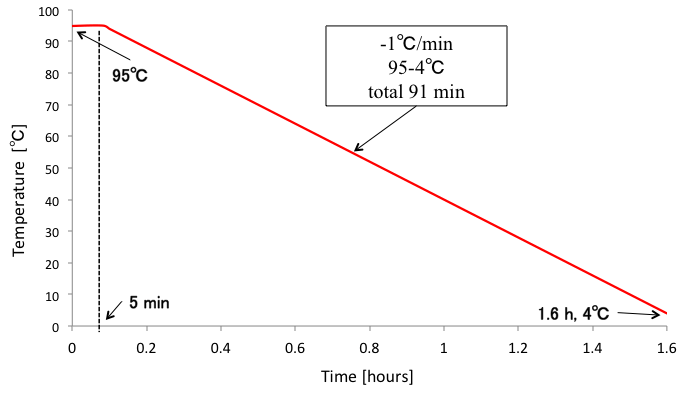
2 Annealing
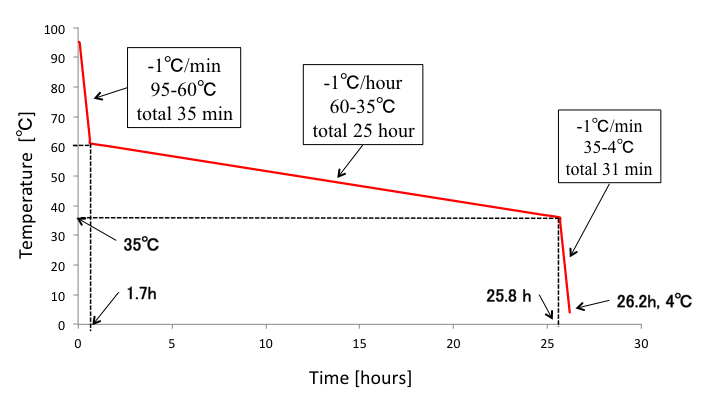
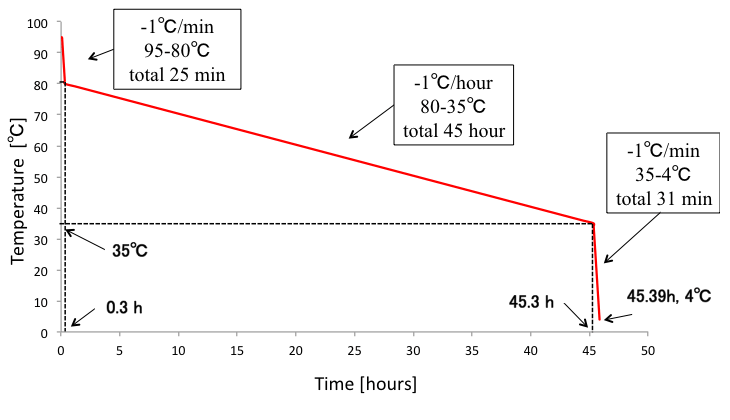
We annealed DNA origami samples by the following conditions (Fig. 3). Furthermore, we tried different annealing conditions as shown in Fig.4-5 to figure out the best annealing condition
Electrophoresis
Gel electrophoresis was conducted by a standard procedure as follows.
- Mix 1×TAE buffer 100mL and agarose gel powder (Takara Japan)0.80g.
- Heat the mixture by microwave for about 30 seconds.
- Pour the heated mixture into the plastic case and leave it for about 30 minutes.
- Set the gel on electrophoresis chamber (Mupid-2plus, Mupid, JAPAN).
- Mix 5µL of sample and 1µL of 6×Loding buffer.
- Apply 6µL of each sample to wells.
- Apply 50V for about 80 minutes.
- Stain the gel by SYBR GOLD for about 20 minutes.
- Observe fluorescence by gel imager (ChemiDoc MP, BIO-RAD, USA).
AFM Imaging
AFM imaging was conducted as follows. We used an observation buffer in Table 3.
- Fix mica (Furuuchi Chemical Corporation, JAPAN) on a glass plate
- Put 2µL of sample solution on mica
- Wait for over 10 minutes
- Set up AFM (Nano Live Vision, RIBM, JAPAN)
- Observe samples with tapping mode (Micro Cantilever, OLYMPUS, JAPAN)
| Concentration[mM] | |
|---|---|
| Tris/Tris-HCl | 20 |
| Mg2+ | 12.5 |
The histogram in Experiment page was based on AFM images below. (Fig. 6)
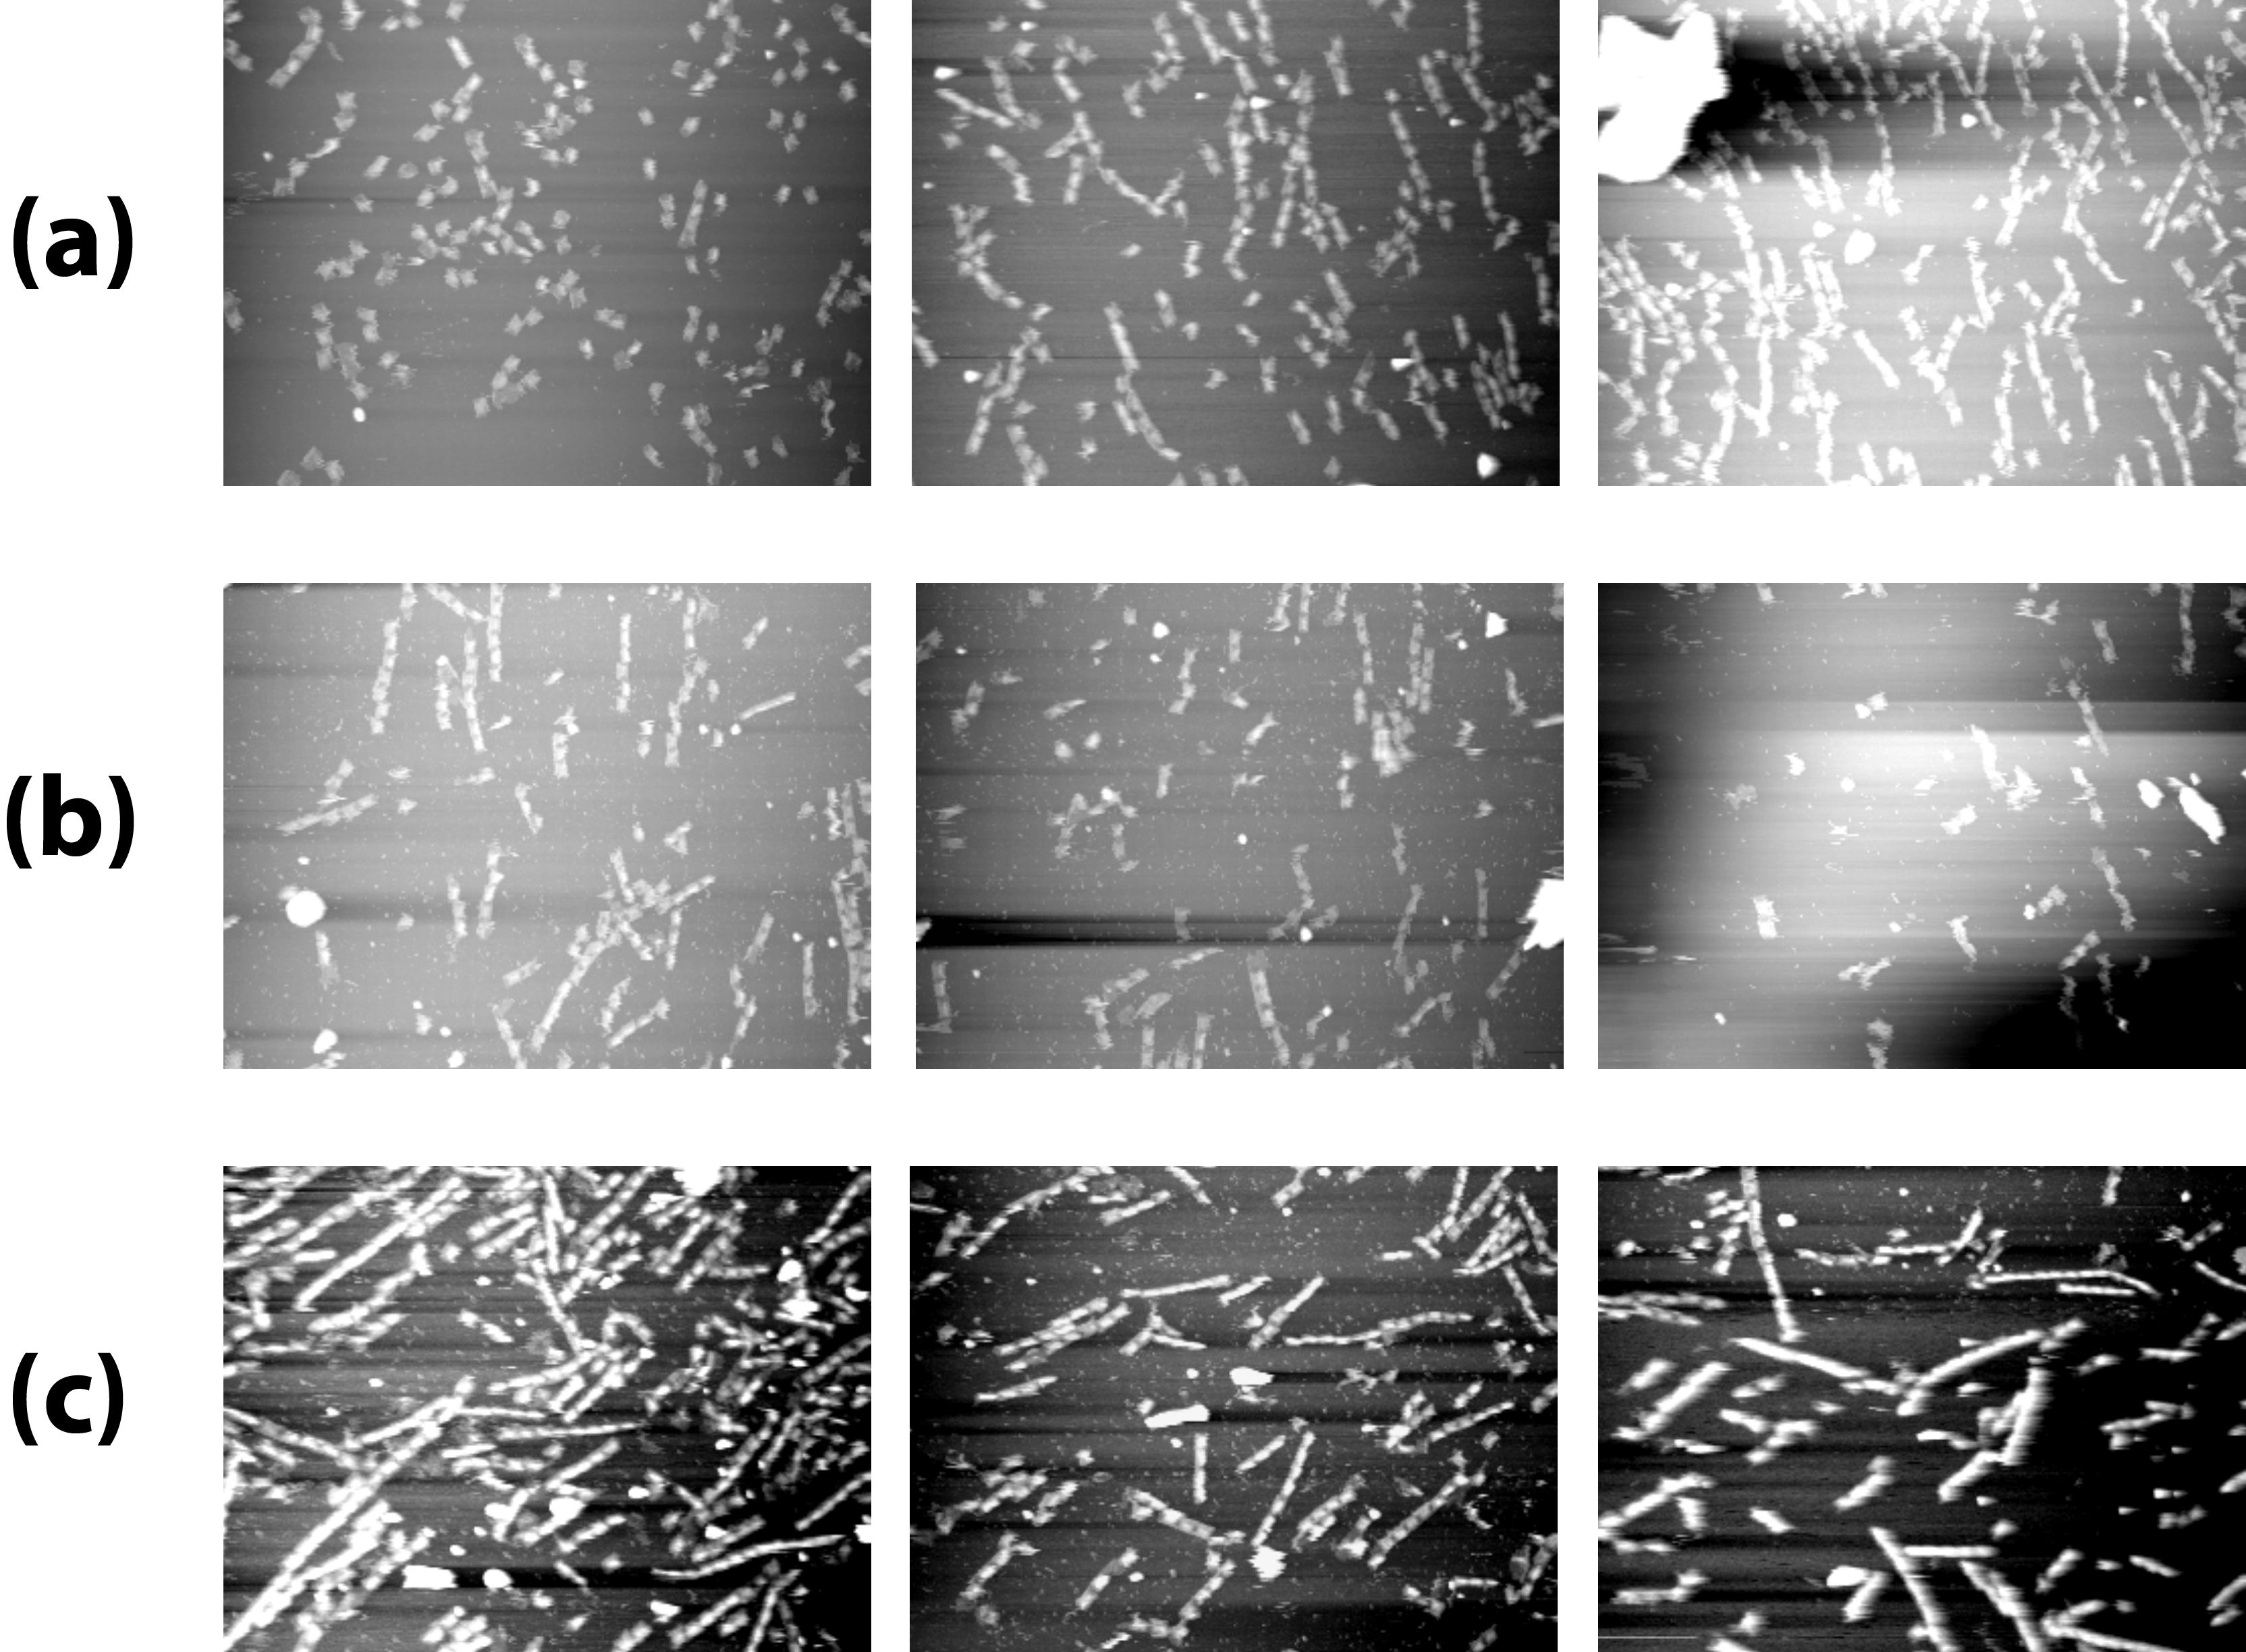
(b)AFM images of (+/+), 2240 ×1680nm
(c) AFM images of (+/-), 2240 ×1680nm
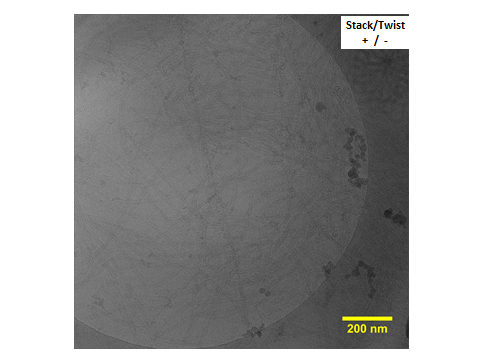
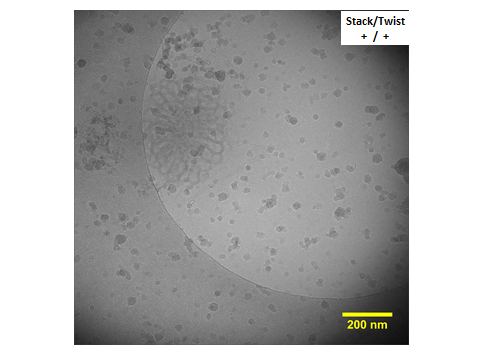
Cryo-TEM
All cryo-TEM images were taken by Terabase Inc. at Okazaki, Aichi, Japan (http://www.terabase.co.jp/English.html). Fig. 10 in Experiment page was trimmed from Fig. 7 which is shown below.
Reconstructed cryo-TEM images in cross and longitudinal section were created from 16 images (cross) and 35 images (longitudinal) respectively. They are shown below. (Fig. 8)
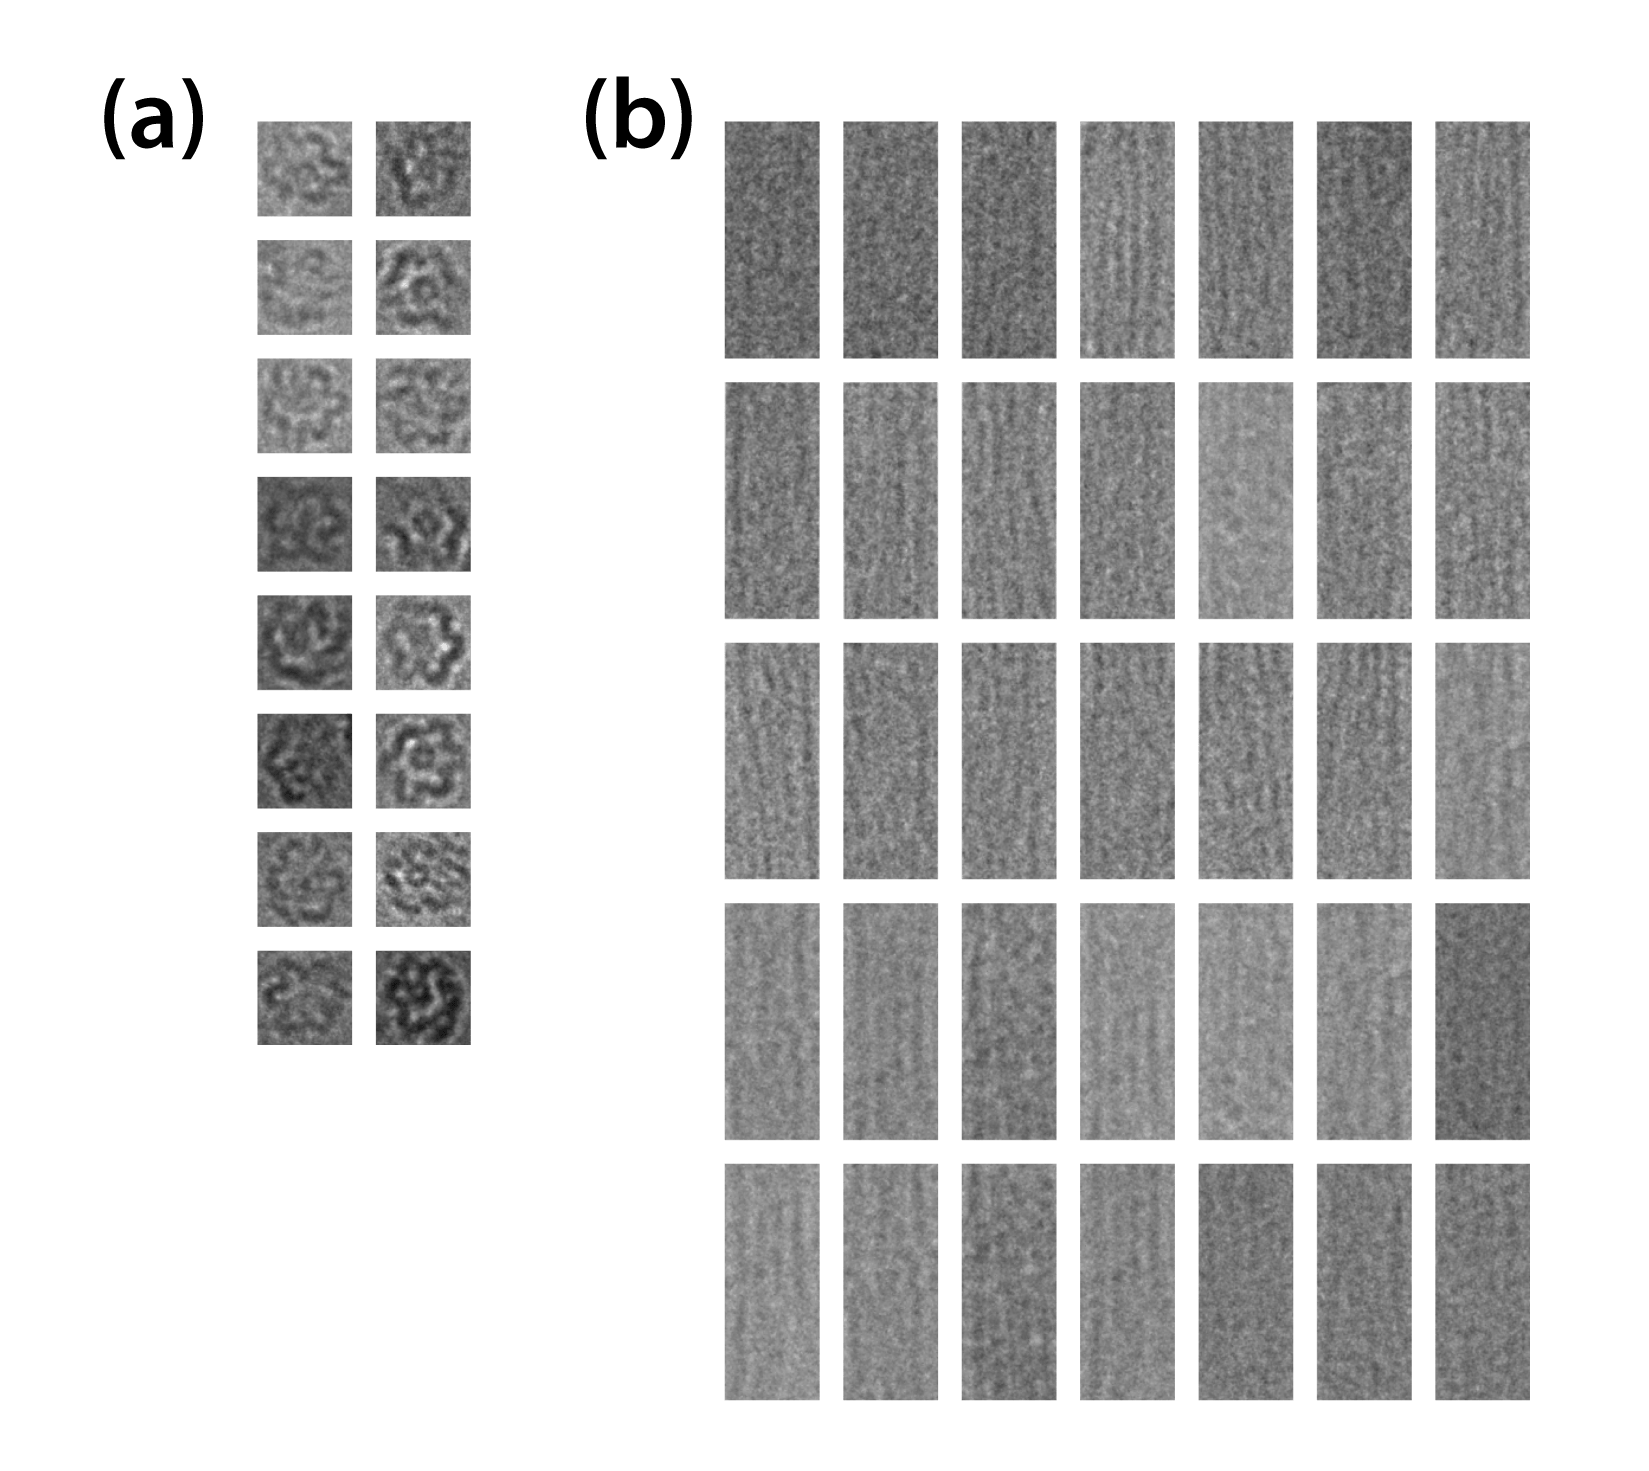
We appreciate Yoko Kayama in Terabase for the kind assists related to TEM observation. Table 4 shows the condition of the observation.
| Magnification | 30K |
|---|---|
| Resolution | 4096×4096 pixels |
| The length of one side | 1333.68nm |
Materials
Each material was purchased from companies below. (Table 5)
| Material | Company |
|---|---|
| Agarose | TAKARA, JAPAN |
| M13mp18 | TAKARA, JAPAN |
| SYBR gold | TAKARA, JAPAN |
| 50xTAE | Wako Pure Chemical Industries, JAPAN |
| 6xloading buffer | TAKARA, JAPAN |
| Staples | Eurofins Genomics, JAPAN |
Equipment
Each equipment was purchased from companies below. (Table 6)
| Equipment | Company |
|---|---|
| Mupid-2plus(Electrophoresis chamber) | Mupid, JAPAN |
| ChemiDoc MP (gel imager) | BIO-RAD, USA |
| Mastercycler pernonal (thermal cycler) | Eppendorf, USA |
| Nano Live Vision (AFM) | RIBM, JAPAN |
| Mica | Furuuchi Chemical Corporation, JAPAN |
| Micro Cantilever | OLYMPUS, JAPAN |